

DashClicks Blog
The industry's top experts offer their best advice, research, how-tos, and insights—all in the name of helping you level-up your business and online marketing skills.
Join Us!
.svg)
.svg)
.svg)
.svg)
.svg)

YouTube Analytics: How to Use Data to Grow Your Channel Faster
YouTube analytics is critical to YouTube marketing strategy. If you use YouTube for business, you must know how to deep-dive into YouTube Analytics.
Irrespective of whether you use YouTube as a marketing platform or plan to earn money directly from your YouTube videos, you need to understand what’s working and what’s not.
When you dive into different YouTube metrics, you get to uncover important details. This information includes traffic sources, keywords users use to find your videos, and audience demographics. In all, you gain valuable insights that help you refine your content strategy with the passage of time. It simply makes sure people continue watching your YouTube videos.
In this post, we’ll discuss how to use YouTube Analytics to grow your channel. Let’s begin:
How to Use YouTube Analytics?
Before you learn to leverage the benefits of YouTube Analytics, you need to know where you will find the data. Here are the steps you can follow for the same:
How to View Analytics on YouTube?
- Log in to your YouTube account.
- Click on your profile icon. You can find it in the upper right corner.
- Select “YouTube Studio”.
- You will be shown a few summary metrics. For even deeper analysis, click on “Analytics” or choose “Go To Channel Analytics.”
- Now, you can easily toggle between Reach, Audience, Engagement, Overview, and Revenue. You will find different metrics in each of these tabs (talked about in detail in the next section).
- To see an exhaustive breakdown of your channel analytics, you can choose “Advanced Mode.” Here, you can also dive into the detailed metrics for each video.
- In the “Advanced Mode,” you can also choose “Compare To.” You can find it in the upper right corner. Once you click on it, you can check how your videos perform against your entire channel and even the year-on-year growth of your channel.

How to View YouTube Analytics on Mobile?
Here are the steps you need to follow to see YouTube Analytics on your mobile device:
- Download the YouTube Studio app.
- Sign in to your account. You will come across some summary metrics.
- Toggle between Reach, Audience, Overview, and Engagement. Here, you can find different metrics in each tab (discussed in detail in the next section).

All About YouTube Metrics
Now that you know how to see YouTube Analytics, here's everything you need to know about YouTube metrics.
YouTube Channel Analytics
You can find these metrics by choosing the Overview tab. You can use such metrics to identify average trends and chart your complete channel performance.

1. Realtime Views: The number of views that your videos got in the last 48 hours. You will see this data in the form of a bar chart with estimated hourly views.
Tip: This data can help you know how your newly updated videos perform on YouTube.
2. Subscribers: The number of individuals who subscribed to your channel over a particular time period.
Tip: Check how this information compares to your usual subscriber growth. If you note a shift from the average, look for the reason behind it.
To determine the cause behind the shift, you can check if you posted less or more videos than usual. Also check the performance of all your videos to ascertain the cause.
3. Channel Views: The number of views your complete channel received over the time period you choose.
4. Top Videos: Your top-performing videos on the basis of their views over a certain time period.
5. Channel Watch Time: The total time individuals spent watching all your channel videos, in hours (calculated over a particular time period).
Tip: Select a 28-day timeframe to compare this information with your average watch-time.
YouTube Reach Metrics
These metrics help you know how people are discovering your videos (in and outside of YouTube). These insights help you make any necessary tweaks to your strategy.

1. Impressions: The total times your video thumbnails were displayed to YouTube viewers.
2. Impressions Click-Through Rate (CTR): The percentage of individuals who clicked on a thumbnail on YouTube to watch your videos.
A high CTR signals that you have done a great job with your keywords and thumbnails.
Listen Up: Check for similar patterns in videos that have low or high CTR. Doing so will offer you insights into what prompts your viewers to click.
3. Top YouTube Search Terms: The top search terms individuals entered in YouTube search that led them to your videos.
This information gives you an idea about your current YouTube keyword strategy. It helps you understand whether you need to make improvements to it.
4. Traffic Sources: Where and how individuals are finding your videos.
Examples of YouTube traffic sources include suggested videos, browse features, search, and playlists.

Listen Up: When you take a look at traffic sources, you also learn about potential collaboration opportunities. You can check “Suggested Videos” to know which channels are driving traffic to your channel.
YouTube Engagement Metrics
Engagement metrics help you know how individuals interact with your videos.

1. Average View Duration: The amount of time your average viewer sees your videos before they click away.
Listen Up: A low average view duration means people watching your video are not getting what they expected from the video after clicking.
2. Top Playlists: Which playlist has the highest watch time overall.

Tip: To increase the performance of your lower-performing playlists, you can always reshuffle the order. Find the video in the playlist that has the highest average view duration and move it to the top position.
YouTube Revenue Metrics
You can go to the Revenue tab to track your earnings (if your account is eligible for YouTube monetization features).
1. Estimated Ad Revenue: The estimated revenue for AdSense and DoubleClick ads for the chosen parameters.
2. Estimated Revenue: The net revenue your channel earned over a chosen time period from all Google-sold ads and transactions.
3. Transaction Revenue: The estimated net revenue from transactions such as Super Chat or paid content for your chosen parameters.
YouTube Audience Metrics
YouTube audience metrics help you gain insights into who watches your videos. This helps you devise effective content strategies.

1. When Your Viewers Are on YouTube: This is a bar chart that shows the times and days most of your channel viewers are on YouTube.
Viewing this data will help you schedule your video uploads at the best time.
2. Unique Viewers: An estimate of the total number of individuals who watched your videos over a particular period.
3. Returning Viewers: People who have watched your channel’s video in the past and have come back for more.
High returning viewers mean that your content is striking a chord among people.
4. Audience Demographics: The gender, language, location, and age statistics for the individuals who watch your channel videos.
This crucial information helps you plan your content according to your audience.
Note: Learn how to create a YouTube content machine that drives insane traffic.
5. Watch Time From Subscribers: The total watch time that comes from your channel subscribers.
If you notice that the watch time from your subscribers is low, you can consider creating a consistent posting schedule and making sure they know about it.
YouTube Video Analytics
You should also track metrics for specific videos. From the Analytics overview screen, click on a video to check its stats.
You can use the Engagement, Reach, and Audience tabs for each video to see different metrics for the video.
1. Views: The total times your video has been viewed (includes repeat views from the same person).
2. Watch Time: The cumulative amount of time individuals have spent viewing a particular video.
Note: Watch time is a major ranking factor in the YouTube algorithm. Videos that have a higher watch time have more chances of showing up in recommendations and search results.
3. Average View Duration: The estimated time (in minutes) watched for each view of the chosen video.
4. Video Subscribers: The number of individuals who subscribed after viewing a video.
This metric is extremely important because it signals if a specific video connected with the people who watched it.
Note: You can also view the count of subscribers lost because of a specific video. This information can also help you ascertain what went wrong because of that particular video.
5. Advanced Mode: Take a look at the “Advanced Mode” reports to know how individual video stats compare to the complete performance of your channel. These insights will help you produce future videos that will definitely show a great performance.
Popular YouTube Analytics Tool
You can also use a reliable YouTube Analytics tool to know about the performance of your channel. A great example of this tool is Analytics app by DashClicks.
Set up YouTube tracking in Google Analytics for an in-depth look at how individuals reach your channel.

Using DashClicks’ Analytics App
Want real-time marketing reporting software at your fingertips? Use the best-in-class Analytics app by DashClicks. It helps you monitor and report on all your marketing campaigns in a single place.
Take a look at the features of this incredible app:
- See granular insights to make smarter marketing decisions and drive better conversions.
- Choose the date range from predefined options or create a custom date range to see all your data.
- Integrate your third party marketing and analytics integrations to the software from an ever-increasing list.
- Get accurate white label reporting quickly and in real-time.
Conclusion
Armed with the knowledge of different YouTube metrics, you can now gather a wealth of information about your YouTube channel and take your YouTube game to a whole different level. YouTube Analytics is extremely important for your business as it helps you grow your channel at a faster pace! Ensure you use the data gathered to create awesome content and gain more customers. Good luck!


How to Use Google Search Console for SEO
SEO is critical for elevating your brand's online presence.
It determines how users discover your site, what types of audiences you'll attract, and where you rank among your competitors.
There are a variety of digital tools available to assist with elevating your SEO strategy. Among these is Google Search Console, a free service for monitoring your website and generating expert reports.
Learning how to take advantage of this gift from Google will help you climb the rankings. After reading this guide, you'll be able to stand shoulder-to-shoulder with some of the top brands in your field online.
What is Google Search Console?
Google Search Console is a free service that helps brands and site owners diagnose technical SEO issues to improve search visibility.
You'll be able to watch your site performance 24/7, while also having the ability to instantly generate reports regarding keyword performance, technical SEO errors, and site security.
Anything that can have an impact on your domain's SEO value can be found by using Google's suite of tools. While it can take some time to get savvy with the service, it has zero barriers to entry making it a necessity for any online brand.
Why is Google Search Console Important for SEO?
Google Search Console is available for free as it actively helps Google to better understand the content found on your website.
While the company is not working to help your brand specifically, they do want to ensure that your content finds the ideal audience. This will help you generate more qualified leads while allowing Google to offer a superior search engine experience for users around the globe.
When you actively take advantage of Google Search Console, you’ll gain instant feedback for the following aspects of your site’s SEO:
- Checking SEO performance for chosen keywords (ranking, search volume, etc.)
- Diagnosing technical SEO issues like loading speeds or navigation errors
- Gathering reports on backlinks pointing to your domain
- Scanning for mobile website usability errors
Furthermore, you can actively help Google by creating your sitemap for navigation, or by submitting new crawl requests when completing major website changes.
You should be monitoring all of the above weekly or monthly to continuously improve your domain authority and avoid falling further down in the rankings. Without Search Console, you rely on automated, periodic check-ins that may inaccurately index your pages, while remaining oblivious to easily fixable site health errors.
How to Create a Google Search Console Account?
Creating your own Google Search Console account is a straightforward process. You can access the setup process on Google’s site here.
To get started, you will require:
- A Google Analytics account
- A domain with DNS verification
- Access to your domain name provider account (GoDaddy, Bluehost, Dreamhost, etc.)
Then, follow these steps:
Step – 1: Enter your website by either using the Domain property or the URL prefix. You’ll see examples of both auto-filled in either field.

Step - 2: It will then check to determine if site ownership has been verified by Google. Since we are creating a new account, you will see the domain ownership verification instructions next.
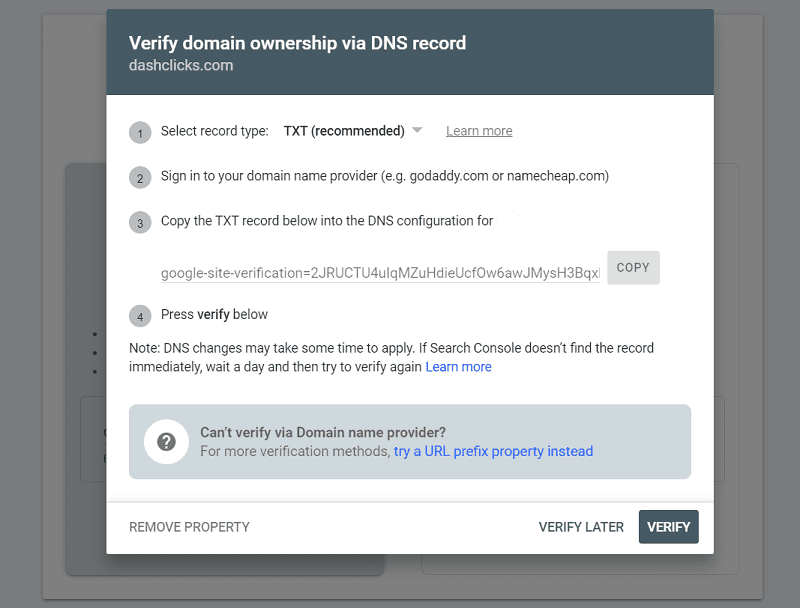
Step - 3: Choose a TXT or CNAME record type (the former is recommended). You'll then need to copy the contents of that record into your domain's DNS configuration on your domain name provider's site. Be sure to save those changes.

Step - 4: Head back to Google Search Console setup and click Verify.
With this, Google will be able to recognize you as the owner of the domain. After the verification is complete, you'll be able to access the Google Search Console tool at any time from the website or your Google Analytics account.
Note that you'll be identified as the Owner of the Search Console account. However, you can add Full Users and Restricted Users by adding one at:
Search Console > Settings > Users and Permissions > Add User
How to Use Google Search Console for SEO?
Once you reach your Google Search Console overview, you'll have access to a variety of powerful SEO tools and features. We recommend getting acquainted with one tool at a time so that you can eventually make full use of this incredible, free service.
Below, we’ll go through the service’s top features:
- Submitting a Sitemap
- Website Performance
- URL Inspection Tool
- Index Report
- Security Report
- Links Report
- Manual Actions
A. Submitting a Sitemap
A sitemap is a map of your website that you create manually to assist with the indexing process.
By default, Google's crawler will follow the links on your website and index the pages naturally. However, by submitting a sitemap, you can tell Google which pages to crawl and which to avoid for several reasons.
The necessity for a sitemap usually is determined by the website size. If you are using a basic website with just a few pages, the navigation is likely very simple allowing the Crawler to index the pages without issue. As your website size grows, especially if you begin to make use of internal linking and redirects, submitting a sitemap is considered best practice.
Your website's CMS likely has a future to create a sitemap for you automatically. This functionality is present on sites like WordPress or Wix. However, you can also create your sitemap file manually as you gain more experience.
You can find detailed instructions on how to set up your sitemap from Google here.
To submit the sitemap file:
- Click on Property and select the appropriate website.
- Under Index, click on Sitemaps.
- Enter the sitemap URL into the required field. Then click Submit.

You can also delete and replace your sitemap at any time by revisiting this section.
B. Website Performance
Your Google Search Console account will feature a Performance tab that shows off key insights about your SEO performance in real-time.
Among these include total clicks, total impressions, clickthrough rates, and average ranking position based on all of your keyword rankings.
You can also filter this traffic data by the source (web, mobile) as well as by period. You can utilize this information to focus on particular periods of high or low clicks to diagnose your SEO strategy and make the necessary improvements.
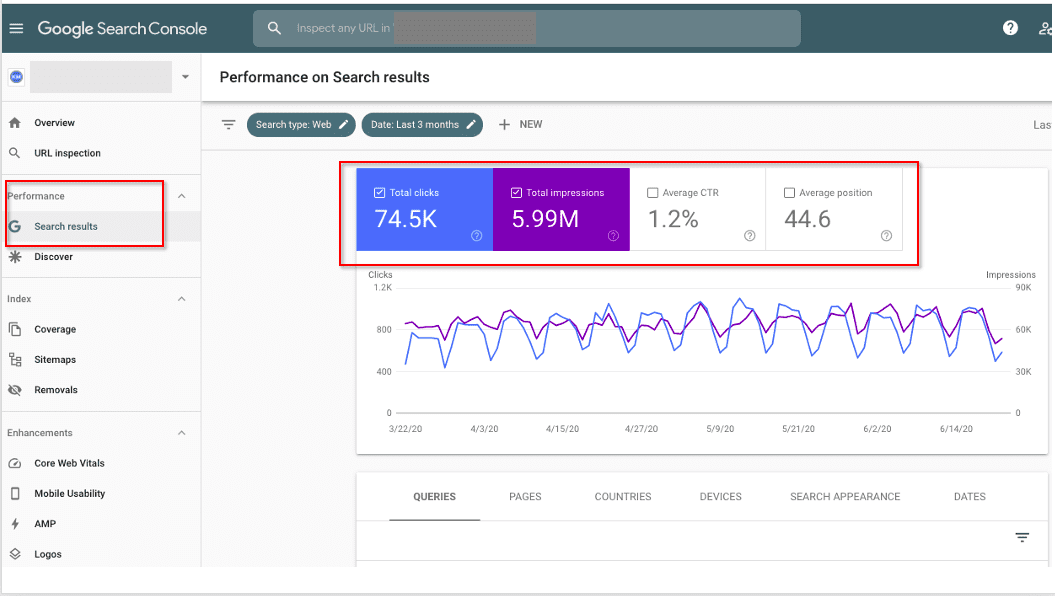
The lower half of this tab allows you to gather more specific data for several key SEO areas.
1. Queries shows the phrases or keywords users are typing to find your website as a result. In some cases, the query might contain a keyword that matches your industry but shows an overall mismatch in search intent. Reviewing your queries will help you understand how you can pivot your content to better communicate your business offerings online.
2. Pages allows you to review the traffic by the individual web page. Because you are ranking each page for a specific keyword, you can review what queries people are using to find a specific page on your domain. Trends in your performance are direct indicators of the type of action necessary to improve your SEO for that page.
3. Countries will show user metrics based on where those visitors are around the globe. If you're making efforts to market to people in different countries, you can segment your data and monitor your performance in real time by location.
4. Devices offers similar features in that you can monitor user activity based on their chosen search device. This can include PCs, tablets, smartphones, and other technology.
Performance data is critical for any marketing channel. Use Google Search Console to monitor your website performance daily and adjust your strategy as necessary to pursue continuous improvements.
C. URL Inspection Tool
The URL Inspection Tool is a popular feature that allows site owners to diagnose a specific web page.
By entering a URL into the tool, you can gain access to a report of how a Google Crawler will view this your URL. It provides reports on two key areas including Index Coverage and AMP enhancements.
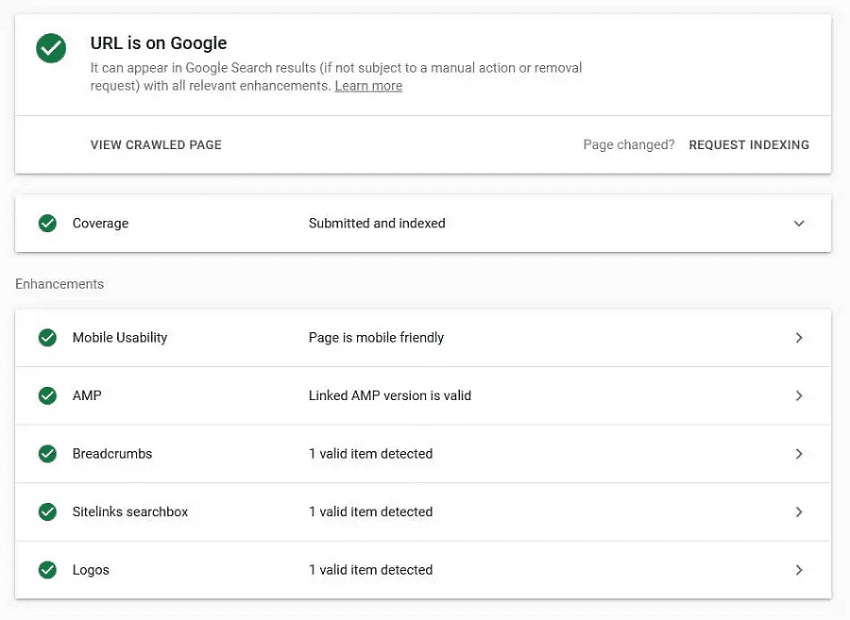
Index Coverage shows whether or not the page is crawlable and if it is currently indexed. It will also display any relevant indexing data such as whether or not this URL is included in the domain sitemap. If you are utilizing any advanced SEO techniques such as placing canonical tags on this URL, those will also appear in the report.
Likewise, any issues that are preventing this page from being indexed will appear here. You can take this actionable data and apply it to the URL so that normal indexing can resume and allow you to continue ranking.
Enhancements will first list out any notable issues with mobile browsing health. Google places a high priority on a smooth mobile experience, so you should use this data to speed things up and present your content more clearly.
You can also check in on any advanced SEO tactics like schema markup here to determine if you are implementing it correctly.
D. Index Report
The Index Report function works much like the Coverage tab in the URL inspection tool. However, instead of diagnosing one page, the Index Report shows the status of every URL found on your domain.
On the top level, this report will show which pages were indexed and which were not. You'll want to focus on the non-indexed pages and review the errors preventing the crawler from doing its job correctly. If Google cannot crawl the URL, it will not appear in search rankings nor will it recognize any SEO or content changes.
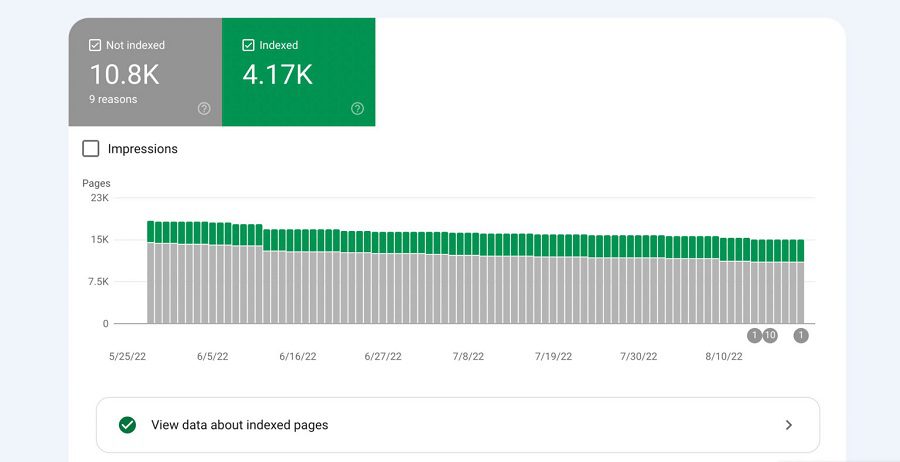
However, the report also shows more useful data as to how you can further improve pages even if they were able to be indexed. The crawler may technically be able to index the URL, but there are warning signs indicating that it may not fully understand your content and which audience it relates to.
Google provides a full list of its indexing errors as well as the actions you should take to eliminate the issue here.
E. Security Report
Unless you have security in order, you'll likely experience a hack at some point as a website owner. Even the top brands in the world face security issues that must be dealt with swiftly to protect the brand and its customers.
Google Search Console attempts to monitor and flag malicious activity by tracking actions taken on the website. The tool primarily scans for these three items:
- Hacked Content – Any unusual injections of content, back-end code, or fishy URLs pointing to untrustworthy sites
- Unknown/Unwanted Software – This applies to anything such as malware or malicious software that can trigger unwanted actions or phish for user information
- Social Engineering – Any content that deceptively coerces users into taking action is social engineering. New content may describe one thing, but lead users to download something else entirely like software or a virus
To protect users, a flag will prevent this page from being indexed and appearing in search results. You should run a security report to review the issue and take the suggested action to resolve the problem.
After you resolve the issue, or if there was an unusual misunderstanding that led to an incorrect flag, you can file a reconsideration review. Google will manually review the URL, but the process can take several weeks to complete.
Security issues are imperative to diagnose as you are held accountable. Even if you are the victim of hacking, it is your responsibility to provide a solution as soon as possible. Failure to do so can get you permanently marked by Google as an offender, making it all but impossible to rank your domain.
F. Links Report
Any time another domain links back to a page on your site, you acquire a backlink.
Backlinks provide powerful SEO benefits, particularly when they come from other high-ranking, reputable sources of information. Part of any successful SEO strategy is to deliver excellent content that's worthy of sharing across the web.
However, the inverse can occur when unreputable or malicious sites begin linking to your pages. In those scenarios, you want to know which sites are referring to your content, so that you can have control over which sites are trying to build a relationship with your domain.
The Links report will generate a list of every backlink pointing to your site. You can check out the top referral sources, see how much traffic you receive, and determine which pages get the most referral traffic.
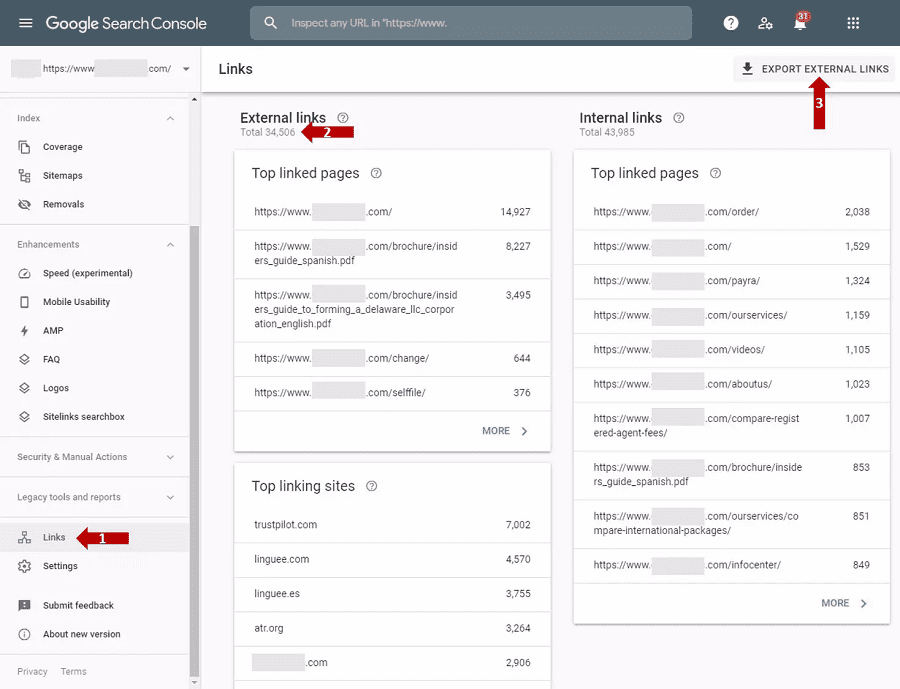
You can use this data for positive results to try and earn more backlinks on other pages that are lagging in performance. Similarly, you'll want to continue supporting valuable pages with lots of backlinks to maximize the organic benefits that your hard work is providing.
For toxic backlinks, you'll now have a list of webmasters to contact. If that link is causing problems for your SEO efforts, you have the right to ask other site owners to remove the link. Google recommends doing this before attempting to take any further action.
If you're unable to get a result, you can use Google Search Console to submit a disavow request. You will need to collect any specific URLs or domains in a list to upload to this page here.
G. Manual Actions
Finally, a Google employee always can take manual action against your domain if they find any violations of their policies. All webmasters have a responsibility to ensure that every page adheres to a set of guidelines that are listed here.
Such actions that would fall under this category might include:
- Implementing deceptive, sneaky redirects
- Scraping high-ranking content from other URLs
- Spamming keywords in an attempt to trick crawlers
- Adding pages with no real content or discernible purpose
Many of these actions are exclusively exploitative, though it is possible to find yourself flagged for issues you did not intend to cause. For instance, using a google search scraper can help you gather relevant search data efficiently, but if not used carefully, it could potentially lead to unintended issues that violate Google’s guidelines.
In either case, you can find any notifications about Manual Actions within your Google Search Console account. As with the other features, you should find a description of the problem as well as suggested actions you should take to resolve the issue.
After you resolve the problem, you'll need to manually request a reviewal of the updated page. Be sure to explain the problem, why it occurred, and what you did to correct it and prevent it from occurring in the future.
Optimize Your Website SEO with DashClicks
Improving your website's SEO is possible thanks to an abundance of free tools like Google Analytics and Google Search Console. However, the process requires dedicated effort and knowledge of the services to obtain worthwhile results. As a site or business owner, that's not always a reality.
DashClicks provides simplified ways to improve and optimize your SEO. Our dedicated Analytics software allows users to track set numbers of keywords along with important snapshots from Search Console like daily traffic, clickthrough rate, search rankings, and much more.
If that's not enough, our dedicated SEO fulfillment team has the trained personnel and resources to ensure your domain gets the love and care it needs to perfect its SEO strategy.
Start with DashClicks today by signing up for your free account and discover a new way to optimize your SEO strategy.

Metrics Reporting: How to Use it to Prevent Your Marketing Campaign From Falling Flat
The success of a marketing campaign heavily depends on tracking the right data points, eliminating the less useful stats and insights, and creating a marketing report that doesn’t take hours from your productive time.
Choice of metrics is crucial to your results because it decides what data points are relevant to your needs and what you want to measure.
The presence of fluff baffles the marketers even more. If you want to measure engagement on your website, “average time spent on your website” is a more relevant metric than the “click-through rate.”
What Is Metrics Reporting?
Metrics reporting quantifies and tracks the most relevant data points that help you assess your performance in the campaign and what it takes to hit your business goals.
When you have real-time access to these data points through a dashboard, you can measure your performance in real-time and know what’s working vs what’s not. It will help you to divert your marketing dollars in the desired direction and minimize wasteful practices.
How to Do Metrics Reporting?
You can do metric reporting in multiple ways, but most methods require manual inputs. You may need to source data from various channels and perform complex calculations to track the desired metrics.
However, thanks to increasing automation in this industry, you’ve platforms like DashClicks that provide integrations with numerous third-party apps. You can easily track the desired metrics through the marketing reporting software in one place.
How to Create a Metrics Report Saving Time and Money?
You might need to track numerous metrics. If it takes a lot of time tracking those metrics, there are chances that you may miss many of the insights.
You can sign up for a robust metrics reporting tool like DashClicks to automate reporting, and it will throw the actionable insights in no time. The Analytics app helps you monitor and report all your marketing campaigns in one place, whereas InstaReports generates the report within a few seconds.
DashClicks platform provides you with real-time updates about your campaigns. It helps you boost client satisfaction and build your brand. Here is what the dashboard looks like.

Here is a software tour of DashClicks explaining how you can use our dashboard to manage your campaigns and get multiple data points as per your needs.
It provides you a snapshot of the various metrics that will help you in decision-making meetings.
How to Choose the Right Metrics?
Choosing the right metrics is not a child's play. Combine them with the wrong ones and it will soon become a maze of confusion with a lot of fluff. Before we discuss the most relevant metrics, let's explain the difference between metrics and KPIs.
While metrics are created around processes and activities required to achieve a business goal, such as traffic or engagement, Key Performance Indicators (KPIs) are related directly to business goals.If you compare the two, metrics provide more context than KPIs and tell you how close you are to your commercial objectives. Metrics are the superset of KPIs, so each KPI must be a metric, but a metric isn't necessarily a KPI.A single KPI can have multiple metrics. So, metrics are mostly tied to business processes and their efficiency, while KPIs tell how you are faring against your business goals.
Metrics => Used to assess the performance of specific business processes
KPIs => Used to ensure that you are hitting your business goals
To achieve your business goals, you need to find the closest metrics. For example, if you want to achieve a high-quality standard, you can use metrics that tell you the number of faulty products and the number of units produced every month.
You must also know how many defective products are delivered to the customers and how many are detected and screened out by your Quality Control professionals.

How to Use Analytics App in Dashclicks for Metrics Reporting?
DashClicks' Analytics application allows you to integrate all your analytics and tracking tools into one central dashboard. With the Analytics app, you can track a quick overview of each service and detailed breakdowns for each integration, such as SalesForce, HubSpot, Facebook Ads, Unbounce, Google Ads, etc.
Our Analytics app currently supports the following analytics and tracking tools:
- Facebook Ads
- Google Ads
- Google Analytics
- CallRail
- SEO
- Listings Manager (an add-on subscription)
If your online marketing campaign primarily depends on these tools, the analytics application is for you. The following video will walk you through the basics of the application.
How to Access the Analytics App?
To access the Analytics application, follow these steps:
Step - 1: Click on the app drawer icon in the top right corner of the screen.
Step - 2: Click on the Analytics icon within the app drawer.

How to Update the Tracking Period?
Finally, you can easily track your performance by updating the tracking period in the top right corner of the page.
Click on it to see a mini-menu where you can select the specific period for your analytics to display. You can click on any of these preset periods from the left side column.

Final Words
Metrics reporting is inevitable while improving your marketing campaigns. It allows you to assess your campaign performance and achieve your business goals.
Each analytics and tracking tool in DashClicks' Analytics app features unique metrics and in-depth customization tools. It's instrumental in ensuring high precision while tracking your performance.
DashClicks' automation tools simplify your life through easy integrations with numerous tools and software programs. Sign up today if you want to achieve your business objectives with more precision and certainty.


How to Monitor KPIs While Scaling an Agency
Many businesses fail because they have no idea about their overall health, strategic direction, or the ability to achieve their goals. Your success lies in your ability to measure your performance in different areas of your business.
KPI (key performance indicator) is a measurable expression companies use to achieve the desired results in different areas relevant to their daily business activities.
With the help of the correct KPIs, you can solidify your strategic plan and know exactly where to focus. Monitoring KPIs is akin to an annual full-body health checkup of your organization. It helps you identify the loopholes and plug them in.
Cost per acquisition, customer lifetime value, traffic, page likes, followers, bounce rate, search engine rankings, and profit margin are some KPIs businesses use to evaluate their performance in different areas.
Value Added by KPIs
KPIs deliver value by helping you achieve the following things:
- Clarity: It helps you paint a clear picture of your strategy. KPIs provide you with the stats in an easy-to-understand manner.
- Focus: They allow you to focus on essential areas that require immediate attention.
- Improvement: It helps to monitor your progress towards your coveted goals.
The insights you get through KPIs also help you tweak budgets, manage teams, and create new products.

What Is KPI Monitoring?
To ensure your agency’s growth and success, you need to track your most crucial metrics by KPI monitoring. It tells you where you stand and what you should do to achieve your goals.
It helps you:
- Identify your realistic business goals and achieve them, whether it’s selling products, improving processes, or boosting monthly subscriptions.
- Identify the most feasible options and best practices for your business, such as the best marketing and social channels.
- Optimize the processes and maximize your marketing ROI to improve future campaigns and replicate the success of the most profitable campaigns.
The KPIs You Should Monitor
DashClicks’ dashboard displays almost everything you may need to measure your business’ performance using the most crucial data points. Use your discretion to choose the most suitable KPIs for your business.
Make a judgment call to see which KPI examples apply to your business and track them accordingly.
A. SEO KPIs
SEO is a skill to master, and it needs to be appropriately done over a few months consistently. Otherwise, it won’t yield any results.
It will help if you put in a lot of effort to attract quality leads through SEO. Create quality content that is unique and engaging to win over your competition.
Use DashClicks’ Analytics tool along with Google Analytics to achieve the best results for your SEO campaigns. Here are some of the SEO KPIs you can track:
- Organic traffic
- Time on page
- Landing page visits
- Number of quality backlinks
- Search engine rankings

Monitoring SEO Campaigns
This screenshot explains how you can track your SEO campaign in the DashClicks dashboard. All you need to do is click on the SEO tab from the Analytics app, which you can fetch from the app drawer.
It displays all the campaign data with prominent SEO metrics.

B. Sales KPIs
Low-quality leads are a familiar problem marketers face. You need to align your marketing and sales teams to achieve high-quality leads. It will work wonders if you can also align customer support and the product development teams.
Here are some sales and revenue-related KPIs you should monitor:
- Customer lifetime value (CLV)
- Sales revenue
- Profit margin
- Cost-per-transaction (The average cost of a single transaction)
- Cart abandonment rate (specifically for eCommerce websites)
C. Social Media KPIs
Social media KPIs are crucial for those brands that attract a sizeable clientele from social media. They also have lots of dedicated followers on social media. It’s assumed that social media has a minimal direct impact on sales, as it’s primarily meant for marketing. Google recognizes social media as a significant ranking factor, so along with SEO, it can do magic for your sales.
To achieve these, you need a better performance in social media metrics such as lots of impressions, likes, and comments. It would help if you also had numerous followers and a highly engaged audience. It increases your brand’s exposure and helps more people know about it.
You can pay attention to the following metrics:
- Followers and Page likes
- Engagement rate
- Reach and impressions
How to Monitor KPIs?
Consolidating data from different channels is tedious, but KPI monitoring tools help you do it faster.
Using the DashClicks platform with a single dashboard, you can quickly view all of your campaign data in one place here.
First, go to the DashClicks Dashboard and:
App Drawer in the DashClicks Dashboard
- Integrate with your chosen data sources
- Open the relevant app from the app drawer
- Select the most crucial metrics
- Drag and drop as you wish
Steps to Monitor KPIs for Your Agency
Here is a three-step procedure to use your chosen KPIs to achieve your business goals.
Step 1: Identify the Most Relevant KPIs
Requirements vary from business to business; hence, identifying the most crucial metrics becomes essential to measure your success. For different companies, there can be different relevant metrics such as traffic, cost per acquisition, outbound sales, and leads, etc.
However, CPC, ROI, and campaign performance are the three most relevant metrics for marketers.
The next step is to know just how well you should perform for each metric to meet your business goals. For example, you might need 40 new customers for your premium subscription plan to break even. It entirely depends on your business type and current situation.
Step 2: Identify the Best Marketing Tools
Thanks to white-label platforms like DashClicks, you can easily plug in KPIs and track them via dashboards. For example, with DashClicks' central dashboard, you can access many apps such as Deals, Analytics, Inbound, and Contacts to manage your sales pipeline.
You should consider the following factors before you choose a marketing tool:
- Pricing: Buying numerous expensive marketing software can be disastrous for your marketing budget. If you sign up for the DashClicks platform, you can get all the necessary tools for a reasonable and affordable monthly subscription fee.
- Features: Before buying a marketing tool, make sure it’s feature-rich and has the monitoring features you are looking for, such as a central dashboard and split testing, etc.
- Integrations: Third-party integrations become crucial in certain situations. Also, ensure that the software you’re buying integrates with your existing tools.
- Users: Check the number of users it allows and if you need to pay a monthly fee for extra users.
Use the trial period to see if the tool works fine for you, including the integrations and user additions.
Step 3: Optimize With Your Findings
Once you’ve set the KPIs, defined your goals, and bought a new tool, it’s time to see whether you can track your performance with the data provided by your software.
Again, there are two scenarios – underperformance and high performance.
- Underperformance – If you fall behind your KPIs, you need to check what’s causing this to happen. Can an automation drive or additional sales training solve the problem? Or do you need to rework your sales and marketing strategy altogether?
- High Performance – If you are performing fine, it isn’t the time for being complacent but to get to work! Determine the factors leading to your performance and optimize them to strive for even better performance.
Final Words
Identifying and tracking your most relevant KPIs gives you Nirvana if you want to ensure that your agency is on the growth path. Many businesses fail because they are unable to track whether or not they are on the right path.
Figure out what metrics are game-changers for your business. Is it CPC, ROI, search engine rankings, traffic, or campaign performance?
Then, search for the best tools and platforms online. If you run an agency, a white label platform that offers analytics, sales pipeline management, lead management, CRM, project management, and a single dashboard can be the best option for you.
Avail free trials to shortlist the best platform for your needs and get your team onboarded. Later on, you can also integrate other tools you use.
You can try DashClicks for free. It's specially designed for digital marketing agencies to scale faster and better.


13 CRM Performance Metrics You Need to Track in 2022
In today's data-driven business environment, data is the new "oil," according to Clive Humby, a British mathematician and entrepreneur. Raw data is useless, so marketers need specific metrics to analyze their businesses and use them to enhance their processes. CRM analytics provides crucial insights directly into multiple areas linked to your business's survival and growth.
Importance of CRM Analytics
Using key CRM metrics, you can manage many areas of your business such as internal workflows, customer experience, ongoing sales, and customer acquisition. Measuring these metrics at the surface level will not yield any results, so you need to dive deep into the CRM data to find ways to boost your revenue.
CRM Analytics You Should Track
Here are 13 key CRM metrics to help you build successful customer relationships and confidently scale your business.
1. Sales Activity Reports
You should track sales activity reports to track whether the MQLs (marketing-qualified leads) shared by the marketing team are converting into sales or not. It will also assess the prospecting tactics used by your sales teams and their effectiveness.
For that, you should track the performance of your emails, etc., using vital email marketing metrics such as open rate and reply rate. If these metrics indicate a dismal performance, you should tweak your email copy.
You can also measure the call to appointments ratio to determine your outbound calls' effectiveness. How many calls turn into meetings indicates your fronters' performance. At the same time, it also tells you the capability of your sales team to convert those sales calls.

Consider implementing an auto attendant to efficiently route inbound calls, helping your sales team connect with the right prospects and improve call-to-appointment ratios.
Pro Tip: AI-powered CRM tools are extremely useful in measuring such KPIs as they help you analyze your prospects' engagement with your brand. They will also suggest what should be your next move.
Pro Tip: You can also use DashClick's Sales CRM software to shorten your sales cycle, automate tasks, and close deals faster with actionable insights.
2. Sales Cycle Duration
A sales cycle indicates the time taken to close one deal. So, it's a rough estimate of the number of days a sales team takes to convert a prospect into a paying customer. The sales cycle largely depends on the industry and product type. Other factors influencing it are product or service cost and stakeholders involved.
Again, identifying the right decision-makers and persistent follow-ups may help shorten your sales cycle. Similarly, contextual engagement and relationship building can also help you in a significant way.

Pro Tip: You can fix many issues related to Sales Cycle Duration using DashClicks CRM. The deals app on our platform will give you comprehensive information about your deals pipeline.
3. Close Rate or Sales Closing Ratio
You can get many sales opportunities through different tactics such as social media advertising, Google Ads, and even organic traffic, but what matters the most is the deals successfully closed by your sales team.
Close rate is a metric that helps you track your sales team's actual performance and the factors responsible for it to take corrective measures. So, this CRM metric is needed to evaluate your sales strategy and identify the factors that lead to lost opportunities.
4. Net New Revenue
Money comes first in a business. If there is no revenue, you can't do business. Net New Revenue is a metric that informs you how much revenue your startup earns. You can periodically track it to check your business's health and your sales team's performance. You can track it every month, once in a quarter, or once a year.
5. Marketing ROI
Marketing may attract an unlimited budget, yet you can be unsure of its impact on your overall sales and profits. Marketing ROI lets you track how your marketing expense contributes to revenue growth. You can easily track it by the number of leads generated against the number of conversions. It helps you decide your marketing spend for future campaigns.
Pro Tip: DashClicks' CRM software and apps will provide insights into your customer behavior. It will also help you refine your target audiences and messaging.
6. Customer Lifetime Value (CLV)
Customer Lifetime Value (CLV) is a crucial metric that helps you project the average revenue you'll earn from a single customer when they stay with you.
You can use the 80:20 rule to target high customer lifetime value. To improve your CLV, you should also pay attention to the customer support and customer experience (CX) you offer. Without that, you will only increase your churn and the number of unhappy customers. It's also directly linked with your branding. If you have a higher CLV, your brand will grow and vice versa. You can increase it by boosting your cross and up-sell and regular subscriptions. If you offer value, your customer would love to buy from you.

7. Outreach Activity
It's an important metric that helps you track every point of contact your salespeople have with prospective customers. It enables you to measure the effectiveness of your prospecting strategy and provides crucial information about the average sales cycle and average follow-ups required to close the sale.
You should pay more attention to quality here than quantity. So, making 15 well-researched and quality daily calls on your refined list is always better than making 40 random cold calls.
8. Leads by Source
This is the Internet age, and your best leads may not come from your sales department. Brands use multiple online channels and consistently receive genuine inquiries and leads. Tracking those sources will give you a good picture of how marketing channels are helping you in lead generation.
Some might be your website visitors, while others may come from social media and other marketing channels. Identifying the channels offering you the best return on your investment might be crucial to your success. Investment of time and effort also pays you back, just like monetary investments.

9. Customer Retention Rate
According to a study, acquiring a new customer can cost five times more than retaining an existing customer. According to another analysis by Small Biz Trends, increasing customer retention by 5% can increase profits from 25-to 95%.
The above stats prove that gaining a new customer is much more expensive than retaining your existing customer. That is the reason brands should focus on retention as much as possible. You should maintain excellent relationships, provide top-notch customer support, and offer an outstanding experience. It will always pay you back many times over.
The formula to calculate the custom retention rate is as follows:

Once you start tracking it, you can further improve it.
10. Net Promoter Score (NPS)
The metric is used to measure customer satisfaction. Customers are asked to share their experiences and feelings about your brand on a scale from one to 10. The lowest score is 0-6, whereas 7-8 is considered good. The latter score suggests that the customers passively enjoy your products and services. But a 9-10 speaks volumes about your business and indicates that they can recommend your product to others. With that score, your customers become your brand ambassadors.
11. Rate of Renewal
This metric is highly beneficial for you if you have a subscription-based business model. It represents the number of customers renewing their subscriptions after their expiration date. It also indicates the value you offer your customers and how fast your business grows.
12. Customer Churn
Customer Churn is also a critical metric because it tells you why customers are leaving your brand. Customer churn or attrition represents why customers are unhappy with your products or services and what you can do to plug in these major loopholes. It is as important as new customer acquisition because if you do not arrest customer churn, it will backfire on you.
13. Customer Acquisition Cost (CAC)
It is an important metric that tells you about the feasibility of your business model and whether your business is sustainable in the long run or not. It also tells you which processes you can automate and how to reduce costs in order to decrease the customer acquisition cost.
A high customer acquisition cost can be disastrous for your business. It would help if you revamped your strategy in that case. It also enables you to identify the red flags in your overall strategy to reconsider your costs and pricing, etc. Your expense may include staffing, marketing, software and tools, taxes, third-party partnerships, training, etc.

Final Words
It would help if you started tracking these crucial CRM metrics to improve your business performance. According to a CRM tool survey, 70% of the businesses saw a noticeable improvement in customer satisfaction.
You can use CRM tools like DashClicks, to improve your company's performance and customer satisfaction. It is equipped with apps such as Deals, Analytics, and Inbound, which bring valuable insights into your business processes. You can access them through a single dashboard.
Sign up for the DashClicks white-label platform for free and improve your business performance.


Content Marketing ROI: The Best Tools, Methods, and Metrics to Measure Content Success
Before we begin, let's consider the following stats:
In a survey of companies using content marketing in their arsenal of digital marketing tools, 74% of companies said that content marketing helped increase their marketing leads, both in quantity and quality.ā (Curata)
Content marketing provides almost six times higher conversion rates than other digital marketing methods.ā (ABG Essentials)
Content marketing is highly effective, as we all know, but just how do you measure its ROI to convince your boss to ask for a budget increase or to generate a report for your client!
There is no formula to measure content success. However, there are a few things you can focus on to evaluate your content’s performance:
- Define the goals you want to achieve
- Set their KPIs
- Track those KPIs
Now, your digital marketing goals can realistically be achieved by content marketing, such as increasing traffic, establishing trust, generating leads, and boosting lead velocity rate (LVR).
You should set goals and track KPIs for each piece of content you produce, including the repurposed content. For example, if you created a podcast and a video using a blog post, you can measure ROI on all three content formats.
Now, switch to the ideal frequency.
Almost 37% of content marketers measure the success of their content every week, while 26% do it every day.
What Is Content Marketing ROI?
Content marketing ROI is a crucial metric that justifies the spending on content marketing efforts compared to the monetary gains.
In general, we can understand it with the help of the following formula.

How to Calculate the ROI?
It isn't easy to calculate the ROI on content marketing because the metrics marketers use can't be directly linked with monetary gains. For example, page views, social engagement, and Time-on-Page have no direct bearing on the sales and business profits, but they surely contribute toward that.
Further, they don't apply to every content marketing channel. For eg., a podcast doesn't have anything equivalent to pageviews.
However, you can establish a relationship between a metric and measurable results such as leads and sales using data. For instance, you can calculate the average page views it takes to generate a lead or close a sale.
Still, different people may have different perceptions about these metrics as far as their contribution to sales is concerned. For example, for some marketers, the number of email subscribers and ebook downloads can be more important than page views and Time-spent-on-page.
So, here is a simple technique to calculate the ROI of your content marketing efforts.
List all the monthly-spend on content marketing, such as:
- External workforce cost (Agencies, experts, freelancers)
- Regular headcount
- Media spend
- Spend on technology (software, tools, subscriptions)
Simultaneously, you should also consider the returns such as visitors and leads, and calculate their dollar value in sales and profit. You can quickly establish it with the help of metrics such as traffic and lead conversion rate, etc.
You also need information about the sale rate, overall profit, and average selling price.
Here is an illustration that explains how you can calculate your content marketing ROI.

Below, we tell you the 4-step process for measuring content success.
4-Step Process for Measuring Content Success
Before we dive into measuring content marketing ROI, you need to understand how marketers measure content success. When measuring content marketing ROI, it's essential to follow this 4-step process.
Step 1: Determine the Objectives of Your Content
Andrew Becks of 301 Digital Media says that the choice of metrics for tracking content performance should match your goal.
For example, direct sales and conversion should be the ideal metrics to track for an eCommerce business.
For a software tool or subscription-based service, tracking customer lifetime value (CLV) is more appropriate.
Choosing your yardstick to measure success is crucial irrespective of your industry or content type. According to Ollie Roddy, former Marketing and Business Development Manager of Catalyst Marketing, your content's success largely depends on the goal it's supposed to fulfill. If you are writing SEO articles, measuring your Google ranking for the targeted keyword is the perfect yardstick for performance measurement.
But, if you are writing content to answer questions and engage customers at different stages in the buyer's journey, you should measure conversion rates. So, tracking is directly related to the goals set by you.
Step 2: Set KPIs for Each of Your Goals
KPIs are the metrics marketers choose to measure their campaign performance. For example, bounce rate and Time-on-Page are the metrics that indicate the engagement level on your website.
Similarly, improved search engine rankings and a high number of inbound links are directly linked with organic traffic.


Pro Tip: KPIs from social media engagement, user behavior, and SEO impact are all you need to measure your performance against any goal.
According to Brandon Andersen of Ceralytics, since ROI is directly linked with finance, your goals must be specific and measurable. If these aren't measurable, you can't assign a monetary value to them. Metrics such as likes, impressions, and shares are vague as they don't tell you much in regards to their monetary value.
For example, you can calculate an inbound lead's average value using this simple formula.

However, it's not always as simple as that. Businesses these days consider various other things apart from leads such as unique sessions and visit-to-signup as even more crucial KPIs for calculating content
ROI.
The most important KPIs to track are as follows:
- Leads
- Visit to Sign Up
- Sessions
- Unique sessions
- Bounce Rate
- Page Views
Jonathan Aufray, co-founder and CEO of Growth Hackers, lists the following three (non-monetary) metrics for tracking:
- Traffic stats (volume and other vital stats such as demographics)
- Leads generated (through email signups)
- Sales
You can measure brand awareness through impressions and clicks. For conversions, determine which content piece specifically triggered sales.
Pro Tip: The best metrics to track ROI are the ones that are related to earning more money.
The metrics such as lead magnet downloads, unique visitors, and conversions are all relevant while measuring the return on your content investment. The idea is to include everything that leads to earning a paying customer.
Step 3: Measure Your KPIs
Restrict yourself to conversion rates, especially if you want to track sales. But there are various other ways you can measure revenue growth through content marketing. Organic rankings and brand awareness are also crucial to track for your campaigns.
Metrics also change with the platform you use. So, CPC has become a crucial metric for Google Ads, LinkedIn campaigns, and Facebook Ads.
As discussed above, to increase organic reach, you need to increase backlinks by posting quality content. But how do you know the quality content is infact working? You can do this by simply measuring your KPIs.
Marketers use Google Search Console, Google Analytics, and SEMrush for measuring campaign performance.
However, the most convenient option is to use a single dashboard rather than using several third-party tools. You can use DashClicks' automation dashboard to measure and track your content marketing performance.
Step 4: Measure Your Progress and Adapt as Needed
Most successful marketers conduct periodic reviews of their content marketing strategies. It ensures that your efforts are paying off. It also provides you an opportunity to learn, change, and adapt to achieve even better results.
For example, let's say you published two articles within a fortnight, and Google indicated incoming traffic growth. You'd think the former article is the one responsible for this traffic. But Google tells you another story. It says your latest article brought you so much traffic.
In the review stage, you will analyze why your recent article became so popular, while your old post struggled to turn any heads. It will provide you with some valuable insights that you can use in your future articles.
Conducting reviews regularly will also help you determine the tactics and trends that yield better results than others, and help you achieve your goals.
To improve your content marketing campaigns, DashClicks provides you with the following metrics:
- Campaign Insights
- Custom date-based reporting
- Multiple integrations
- Real-time reporting

Are You Ready to Start Driving ROI for Your Content Marketing Efforts?
While calculating content marketing ROI isn't an easy task, you can use the calculation methods described above and the 4-step process for measuring content success. You can also gather essential information to be used, such as visitors, leads, and sales, using the DashClicks dashboard.


No results found.
Please try different keywords.
Get Started with
DashClicks Today
Get found online, convert leads faster, generate more revenue, and improve your reputation with our all-in-one platform.
.svg)
Unlimited Sub-Accounts
Unlimited Users
All Apps
All Features
White-Labeled
Active Community
Mobile App
Live Support
100+ Tutorials
Unlimited Sub-Accounts
Unlimited Users
All Apps
All Features
White-Labeled
Active Community
Mobile App
Live Support
100+ Tutorials
Unlimited Sub-Accounts
Unlimited Users
All Apps
All Features
White-Labeled
Active Community
Mobile App
Live Support
100+ Tutorials


