

DashClicks Blog
The industry's top experts offer their best advice, research, how-tos, and insights—all in the name of helping you level-up your business and online marketing skills.
Join Us!
.svg)
.svg)
.svg)
.svg)
.svg)

Startup Growth by the Numbers: Key Metrics Founders Should Track
Most startups don't fail because founders ignore their numbers. They fail because they watch the wrong ones. According to government data, a significant share of small businesses close within their first few years, and poor financial tracking is a consistent factor. Knowing which numbers actually matter is where sustainable growth begins.
The metrics that deserve regular attention fall into a few clear categories: growth signals like revenue, MRR (monthly recurring revenue), and ARR (annual recurring revenue); efficiency markers like CAC (customer acquisition cost), LTV (lifetime value), and gross margin; and survival indicators like burn rate, runway, and churn rate. Retention sits across all three, making it one of the most telling signals a founder can track.
The difference between KPIs and metrics matters here too, since not every number earns weekly attention. Vanity metrics like total signups or page views can look impressive without revealing anything about unit economics or business health. The metrics worth tracking function as operating signals. They tell founders what's working, what's breaking, and what needs a decision now.
The Metrics Founders Should Watch First
Before grouping or prioritizing, it helps to have a clear shortlist in view. The core metrics most founders need to monitor span three areas: growth, efficiency, and survival. That includes revenue, MRR, ARR, CAC, LTV, churn rate, retention, burn rate, runway, and gross margin. The right mix depends on the business model, but these cover the fundamentals across nearly every startup type.
What separates useful metrics from noise is whether they connect to action. Vanity metrics like raw traffic or total downloads can look encouraging without telling founders anything about activation, retention, or revenue. Operating signals, on the other hand, reveal what's actually happening inside the business and point toward decisions that need to be made. That distinction is worth keeping in mind as the sections below break these numbers down further.
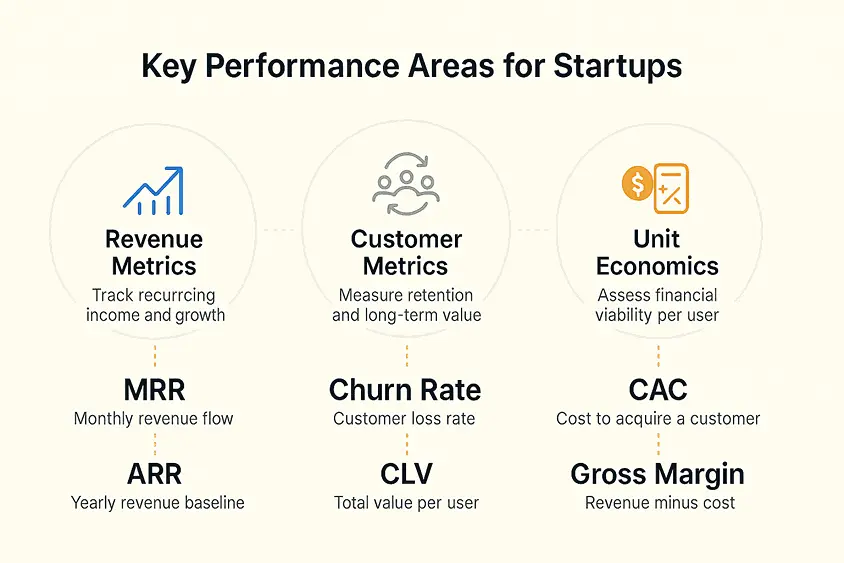
Image Source: Qubit
How to Group Metrics by What They Reveal?
Not every metric answers the same question. Some tell founders whether the business can stay alive long enough to find its footing. Others reveal whether users actually want the product. Still others show whether growth can scale without burning through cash faster than it comes in. Grouping them by what they reveal makes the whole picture easier to act on.
1. Financial Health and Survival
These metrics answer one fundamental question: can the company keep operating? Burn rate measures how quickly cash is leaving the business each month, while runway shows how many months remain before that cash runs out. Revenue and gross margin round out this group. Revenue confirms that money is coming in, and gross margin shows how much of it the business actually keeps after direct costs.
Interpreting these numbers in isolation can be misleading. Resources like Zeni offer benchmarking context that helps founders assess whether a metric trend is ordinary or genuinely concerning, which is especially useful when there's no internal baseline to compare against yet.
2. Customer and Product Traction
Retention and churn rate are the clearest signals of whether a product is delivering real value. High retention points to product-market fit, while rising churn is an early warning that something isn't working. Activation, meaning whether new users reach a meaningful milestone early on, often predicts retention before enough time has passed to measure it directly. These retention and satisfaction signals matter especially in SaaS, where compounding subscriber loss adds up quickly.
3. Growth Efficiency
CAC, LTV, and the LTV:CAC ratio sit at the center of unit economics. CAC measures what it costs to acquire a customer, and LTV measures what that customer is worth over time. The ratio between them tells founders whether their growth model is sustainable. When this ratio is healthy, scaling becomes a more confident decision. When it isn't, more growth often means more loss.
Which Metrics Matter Most at Each Stage?
Metric priorities don't stay fixed as a startup matures. What matters at pre-seed looks quite different from what investors scrutinize at Series A, and understanding that shift helps founders focus on the right signals at the right time rather than tracking everything at once.
1. Pre-Seed and Seed Priorities
At pre-seed and seed stage, investors aren't expecting polished dashboards or perfectly optimized unit economics. What they're looking for is evidence that real demand exists and that the business can survive long enough to validate it.
The tightest focus at this stage should be on retention, activation, and burn rate. Client retention shows whether early users are finding genuine value in the product, while burn rate and runway determine how much time founders have to keep iterating. Early revenue matters too, even if it's modest, because it signals that someone is willing to pay.
For B2B and SaaS startups in particular, cohort retention data carries extra weight at seed stage. It's one of the earliest indicators of product-market fit, long before MRR or ARR figures reach meaningful scale.
2. Series A and Beyond
By Series A, the conversation shifts from survival signals to scalable economics. Investors at this stage want to see that growth is predictable, that the unit economics hold under pressure, and that the business isn't acquiring customers at a loss.
MRR and ARR quality become central, not just their size. Churn rate, gross margin, CAC, and LTV all come under closer scrutiny because they reveal whether the growth model can sustain itself. A strong LTV:CAC ratio is one of the clearest signals that the business has found an efficient path to growth.
Retention continues to matter at every stage, but by Series A it functions as a product-market fit signal rather than just a usage stat, and investors read it that way.
How Metrics Shape Investor Updates?
Investors don't evaluate startups in a single good month. What they look for is trend lines, the relationship between growth and efficiency, and evidence that founders understand their own operating picture. Consistency in how metrics are tracked and presented carries real weight in that conversation.
The metrics most relevant to investor updates include revenue, MRR, burn rate, runway, CAC, churn rate, retention, and gross margin. These aren't chosen arbitrarily. Firms like Y Combinator and a16z consistently emphasize unit economics and capital efficiency when evaluating startups, and these metrics speak directly to both.
Presenting metrics well means showing direction, not just snapshots. A single strong CAC figure tells investors less than three quarters of improving CAC alongside stable gross margin. The goal is to demonstrate operational control, showing that growth isn't happening by accident and that the team understands what's driving it.
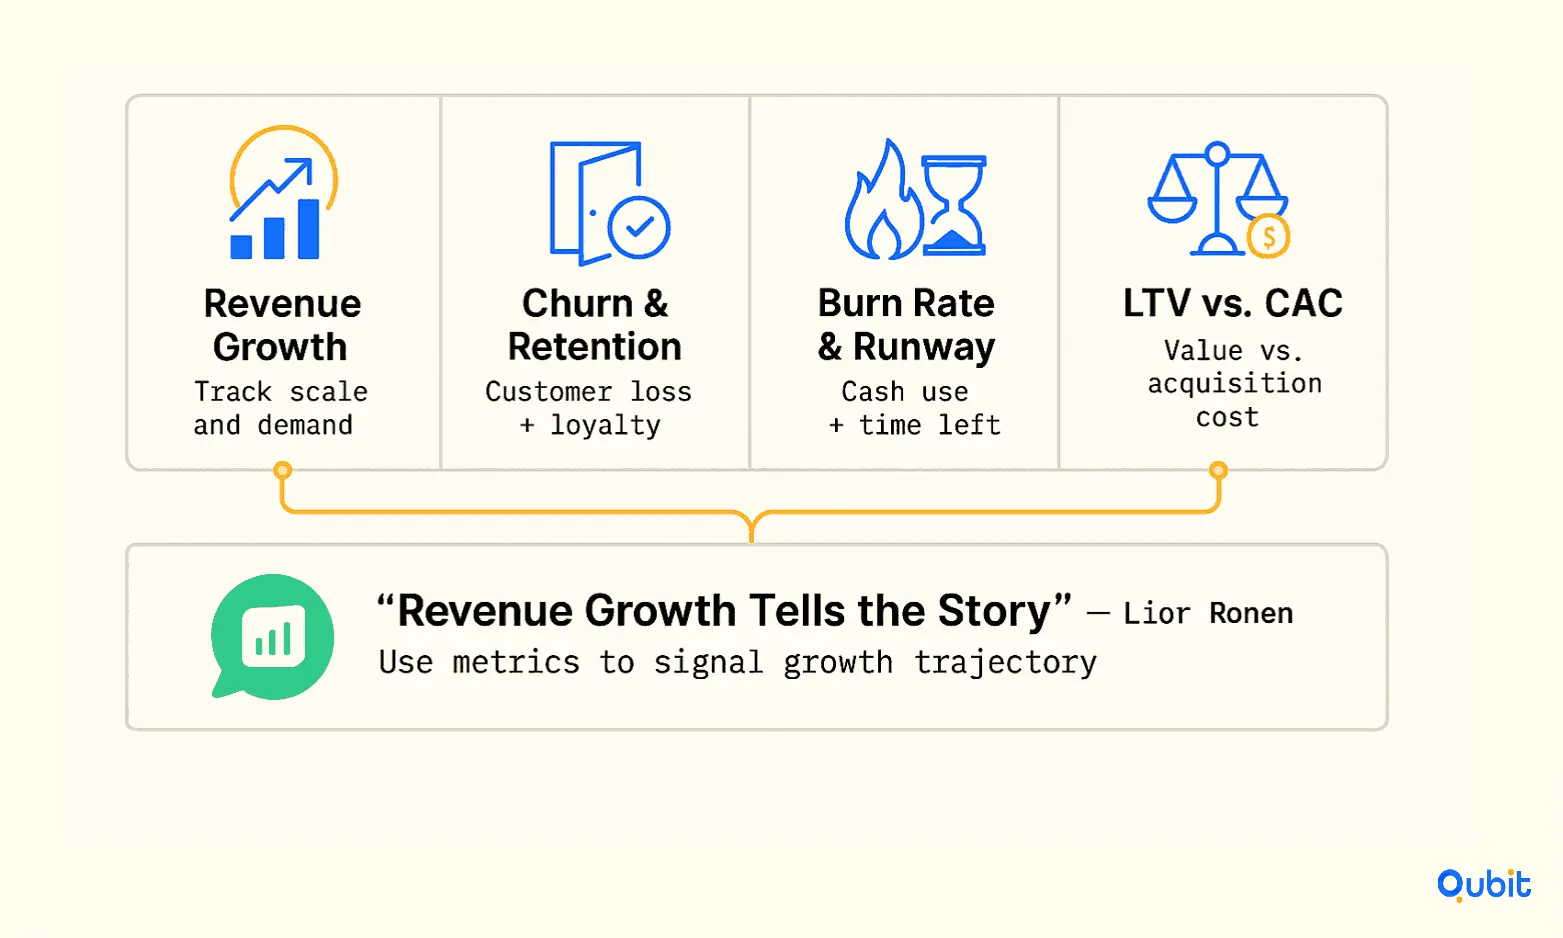
Image Source: Qubit
Founders should also avoid common presentation traps. Cumulative graphs without period-over-period context can make a slowing business look like it's still accelerating. Vanity metrics in pitch materials, like total registered users without any retention data, tend to raise more skepticism than confidence. Investors reading those materials have seen the patterns before, and selective framing often signals the opposite of what founders intend.
Using Metrics to Make Better Strategic Decisions
Metrics become valuable when they influence action. The numbers founders track should help answer practical questions about growth, spending, hiring, and long-term sustainability.
- Hiring and Team Growth: Revenue, runway, and burn rate can help determine whether the business is in a position to expand its team.
- Marketing Investment: CAC, conversion rates, and retention data can reveal whether increasing startup marketing spend is likely to generate profitable growth.
- Product Development Priorities: Retention, churn, and activation metrics often highlight areas of the customer experience that need improvement.
- Fundraising Readiness: Investors typically look for consistent growth, efficient customer acquisition, and strong retention trends rather than isolated performance spikes.
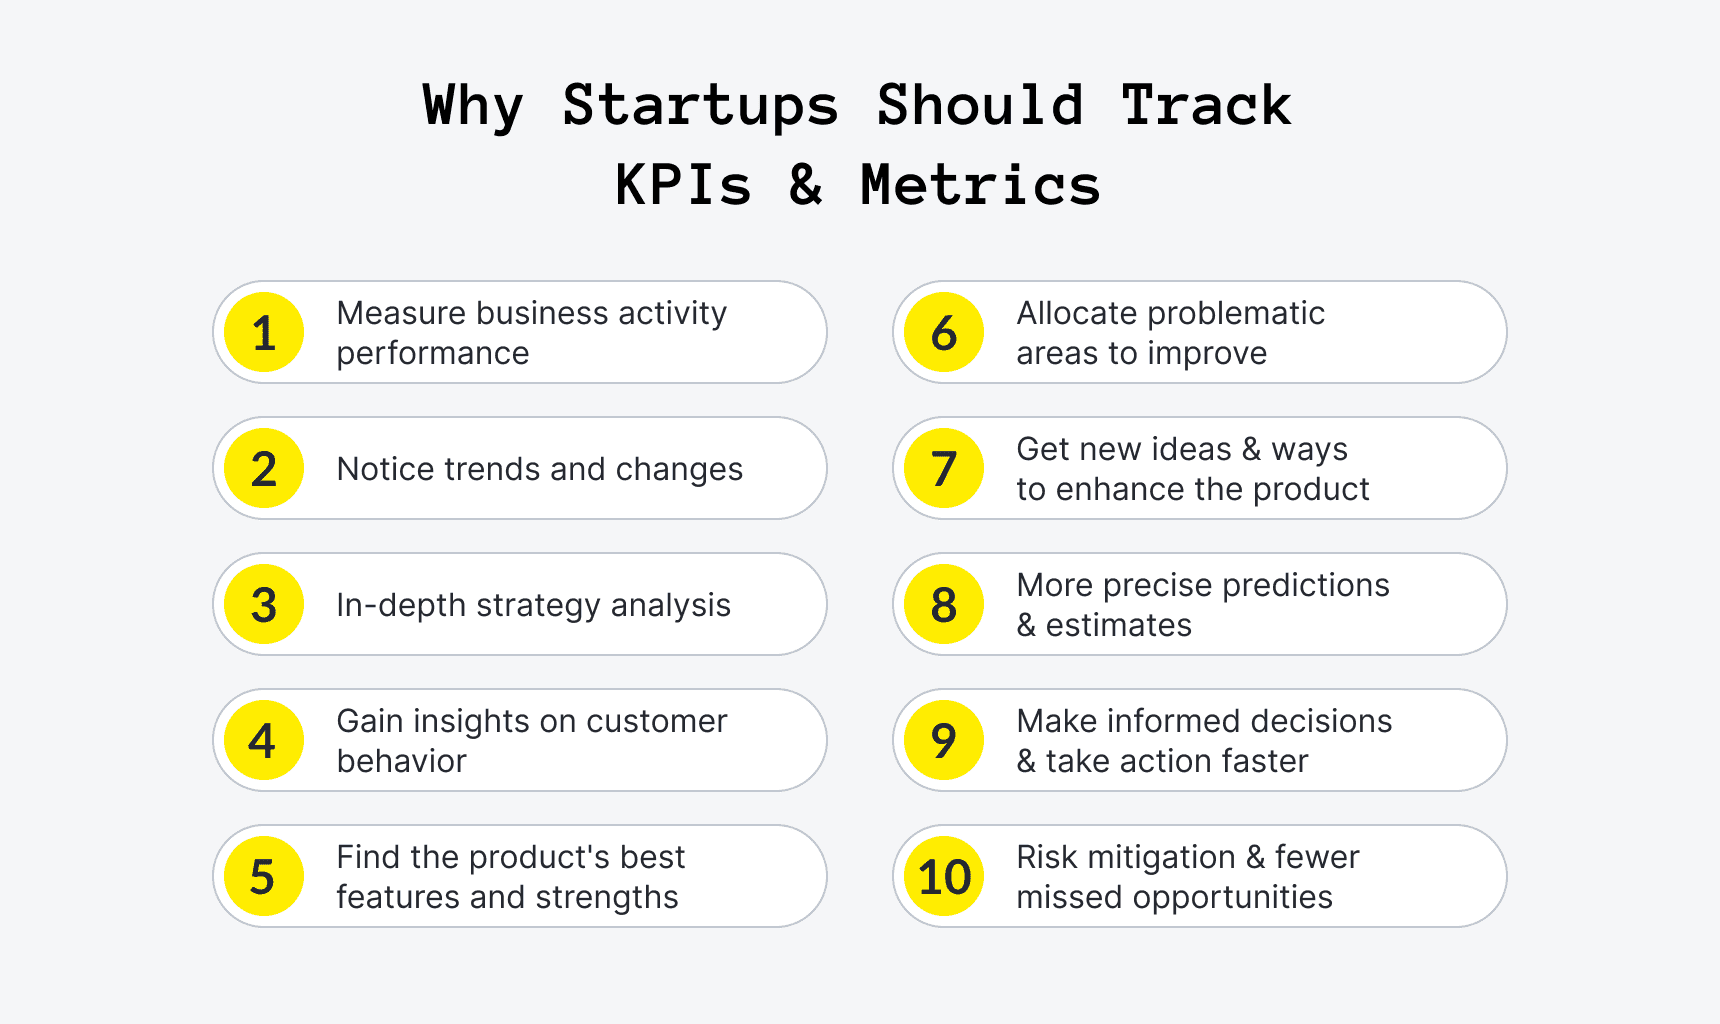
Image Source: Upsilon
When metrics are tied to strategic decisions, they become more than reporting tools—they become a framework for guiding growth.
Common Startup Metric Mistakes to Avoid
Founders don't always struggle because they lack data. In many cases, the challenge is interpreting that data correctly. Even the most important metrics can lead to poor decisions when they're viewed without context or tracked inconsistently.
- Mistake #1: Prioritizing Vanity Metrics: Brief explanation of why traffic, downloads, or social followers don't necessarily translate into business growth.
- Mistake #2: Ignoring Retention: Explain why acquiring customers is only half the equation and why churn often reveals deeper issues.
- Mistake #3: Tracking Too Many KPIs: Discuss how crowded dashboards can make it harder to identify what actually needs attention.
- Mistake #4: Focusing on Individual Data Points: Explain the importance of trends over single-month performance.
Avoiding these mistakes helps founders maintain a clearer view of business performance and make more informed decisions as the company grows.
Centralizing Metrics as Your Startup Grows
Tracking startup metrics becomes more challenging as revenue, customer, and marketing data spread across multiple platforms. A centralized reporting system can make it easier to maintain visibility and identify trends before they become larger issues.
Unified Performance Tracking
Bringing key business data into one dashboard can help founders:
- Monitor growth metrics more efficiently
- Spot changes in performance sooner
- Reduce time spent compiling reports
- Keep teams aligned around shared KPIs
Tools That Support Better Visibility
Platforms like DashClicks offer several tools that can help simplify metric tracking:
- Dashboard & Insights Tools for monitoring performance data in a single view
- Analytics Software for measuring marketing and campaign performance
- CRM Software for tracking customer interactions and sales activity
- InstaReports for automating reporting and sharing business insights
Focus on Actionable Data
The goal isn't to create a dashboard packed with every available KPI. Instead, founders should prioritize a reporting system that keeps their most important metrics visible, accessible, and easy to act on as the business scales.
Track Fewer Metrics, but Track Them Well
The best startup metrics aren't the most impressive ones on a slide deck. They're the ones that actually change a decision. Founders who track retention, burn rate, runway, CAC, and revenue consistently tend to have a clearer operating picture than those juggling a dozen numbers that rarely lead anywhere actionable.
A cluttered dashboard creates the illusion of oversight without the substance of it. The goal is a focused set of metrics tied to the current stage and business model, reviewed on a rhythm that matches how fast things are actually moving.
Growth, retention, efficiency, and cash management each tell a different part of the story. Together, they give founders the clarity to make better calls, sooner.

Predictive Analytics in Marketing: A Practical Guide for Agencies
Marketing is not only about advertising and observing results; agencies today need a long-term plan and more intelligent choices before investing resources. Predictive analytics plays an important role here, helping agencies understand what is likely to happen next based on past data.
However, gaining these insights requires a clean, centralized data environment. Small businesses operating with scattered external drives or limited cloud storage hit a predictable wall: data growth outpaces their makeshift systems, creating access delays and collaboration breakdowns.
To overcome this and leverage true predictive modeling, many firms choose to outsource marketing operations to a professional virtual assistant agency. This allows dedicated remote specialists to reorganize the data architecture, turning fragmented logs into the actionable intelligence needed for sustainable growth.
You don’t have to guess when you can base decisions on numbers. Your campaigns will be more successful, and you’ll be able to provide even better service to your clients.
What Is Predictive Analytics?
Predictive analysis involves using historical data to predict future events. This requires analyzing digital marketing trends and patterns to help determine the next course of action.
For instance, if a consumer visits your website repeatedly without making any purchases, predictive analytics can help determine the likelihood that they will make future purchases. Using this, you can plan appropriately.

Image Source: Adjust
Predictive analytics does not always provide definite responses, but it provides definite guidance. This is sufficient for making marketing strategies.
Why Agencies Should Care About Predictive Analytics?
Organizations operate differently in terms of clients, budgets, and objectives. It is important to make the right decision fast. For those currently building or scaling their firm, using a platform like ZenBusiness can help manage the essential legal and compliance tasks, allowing you to focus more on high-level strategies like predictive analytics. Predictive analysis plays an important role in minimizing delays in campaign planning.
You can focus on the right audience, improve campaign performance, use the budget more wisely, and show better results to clients. When you can predict outcomes, you can plan better and avoid waste.
How Predictive Analytics Works in Marketing?
The process of predictive analytics involves analyzing various types of data from multiple sources, including website activity, past campaigns, consumer behavior, and transaction records.
For example, when a certain number of consumers purchase an item upon viewing three advertisements, this strategy can be replicated in future marketing campaigns.
This also helps identify valuable clients. These are individuals who are more likely to make purchases or spend a significant amount. Agencies with better deals and communications can target these.
When working with large datasets in marketing, even small formatting inconsistencies can create confusion. For example, inconsistent text cases in client data or campaign reports can impact readability and analysis. Using a reliable Case Converter tool can help standardize text quickly, whether you’re preparing reports, cleaning CRM data, or organizing campaign assets.
Tools like Forge Sparse Case Converter tool make it easy to switch between uppercase, lowercase, or proper case without manual effort. This small step improves data clarity, making your predictive analytics insights more accurate and easier to interpret across teams.
Common Uses of Predictive Analytics
Agencies can use predictive analytics in multiple ways. The most popular application is lead scoring, in which you rank your leads by their conversion potential. AI agents for lead qualification take this further by automating real-time prioritization and engagement based on behavioral signals.
Predictive analytics is helpful in campaign development. The analytics will help you identify which communication method and timing are ideal for a particular campaign.
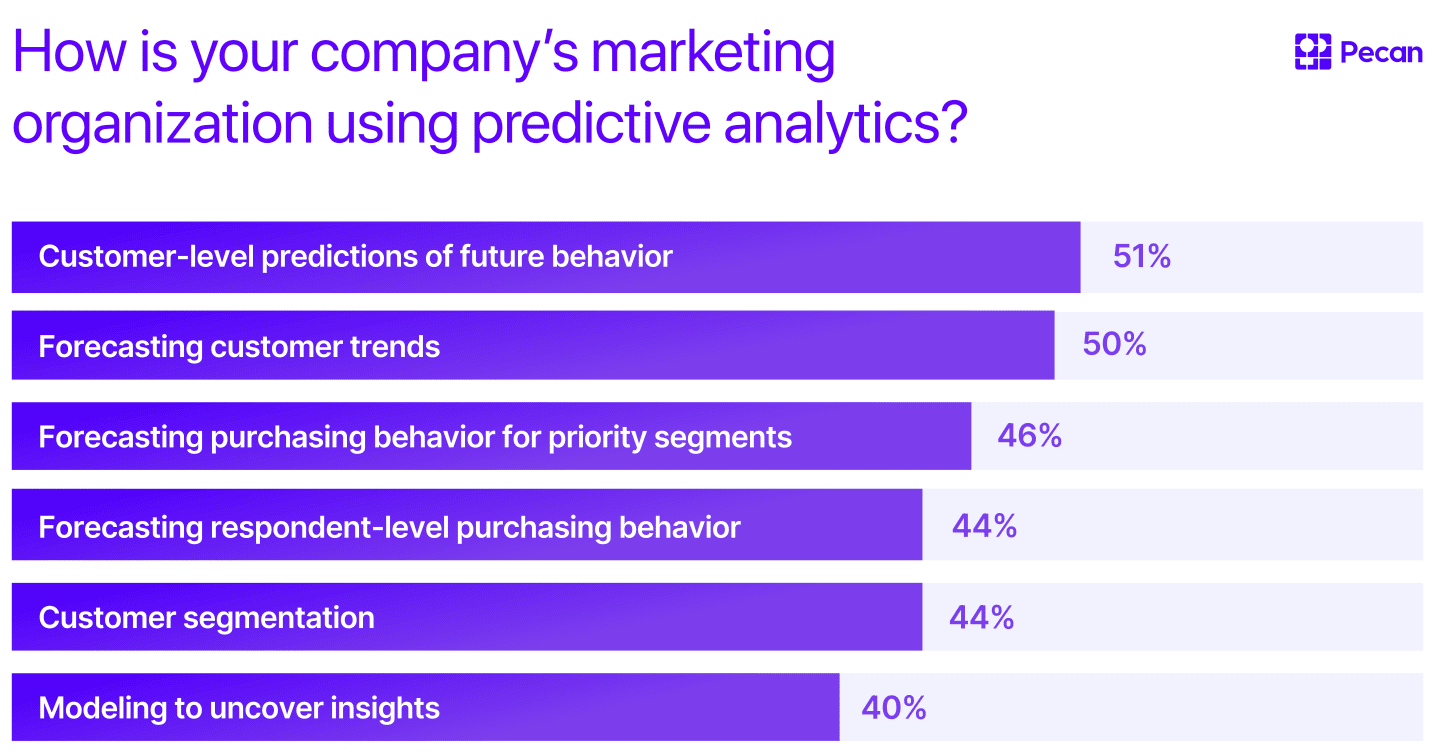
Image Source: Pecan
1. Improving Targeting
A major advantage of predictive analytics is improved targeting. Rather than displaying advertisements to everyone, you will target those most likely to engage.
If studies show that a particular age range responds well to your advertisements, you can adjust your targeting. If some users prefer email communications or happens to be a highly engaged Snapchat story viewer, predictive analytics helps you connect with them on their preferred platform.
It reduces costs while improving outcomes. It also leads to a superior user experience because the advertisements are more relevant to them.
2. Better Campaign Timing
Timing is important in marketing. If you send your communication at the wrong time, then your efforts may prove ineffective.
Using predictive analytics, you can determine the best timing for your messages. By analyzing historical data, you can learn when clients are most engaged.
For example, if the analysis suggests that your clients receive emails at night, it would be wise to schedule your campaign messages for that time.
3. Personalization Made Easier
Personalization is very important in marketing today. The client expects brands to know their needs.
Predictive analysis will make personalization possible. It will allow you to present the correct information to the correct client segment.
For example, when your consumer shows interest in a particular product, you can suggest other similar products. This is helpful in increasing conversions, and is especially useful in multichannel ecommerce, where sellers need to target multiple client bases simultaneously.
Additionally, predictive analysis will create an even stronger connection between you and the consumer.
4. Budget Optimization
Each client desires greater success without spending as much money. Using predictive analytics and smart budget tracking will help you get the most out of your budget.
You will know beforehand what kind of campaigns will succeed and which ones will fail. You can thus invest more in your successful campaign initiatives.
Moreover, you can cut costs for those campaigns that have failed to deliver the required outcomes.
Challenges Agencies May Face
As much as predictive analytics is helpful, it is not always simple to apply.
For example, data issues pose a significant difficulty. If the data you have is inaccurate or incomplete, then the predictions will be incorrect. This is why agencies must regularly clean and organize their data before using predictive tools.
Another difficulty is comprehending the tools, especially when predictive systems are implemented without proper technical audit services or internal expertise. Some platforms might be complicated to understand for some people. Teams may also struggle to interpret reports correctly, which can lead to poor marketing decisions.
Integration can also become a challenge. Many agencies use multiple marketing platforms, and combining data from different sources is not always easy. Without proper integration, important insights may be missed.
Finally, there is a problem with overreliance. Although predictive analytics is helpful, decision-making should never be left entirely to the system. Human judgment, creativity, and market understanding are still important when planning campaigns.
However, agencies that start small, train their teams properly, and focus on data quality can gradually overcome these challenges and improve their marketing results over time.
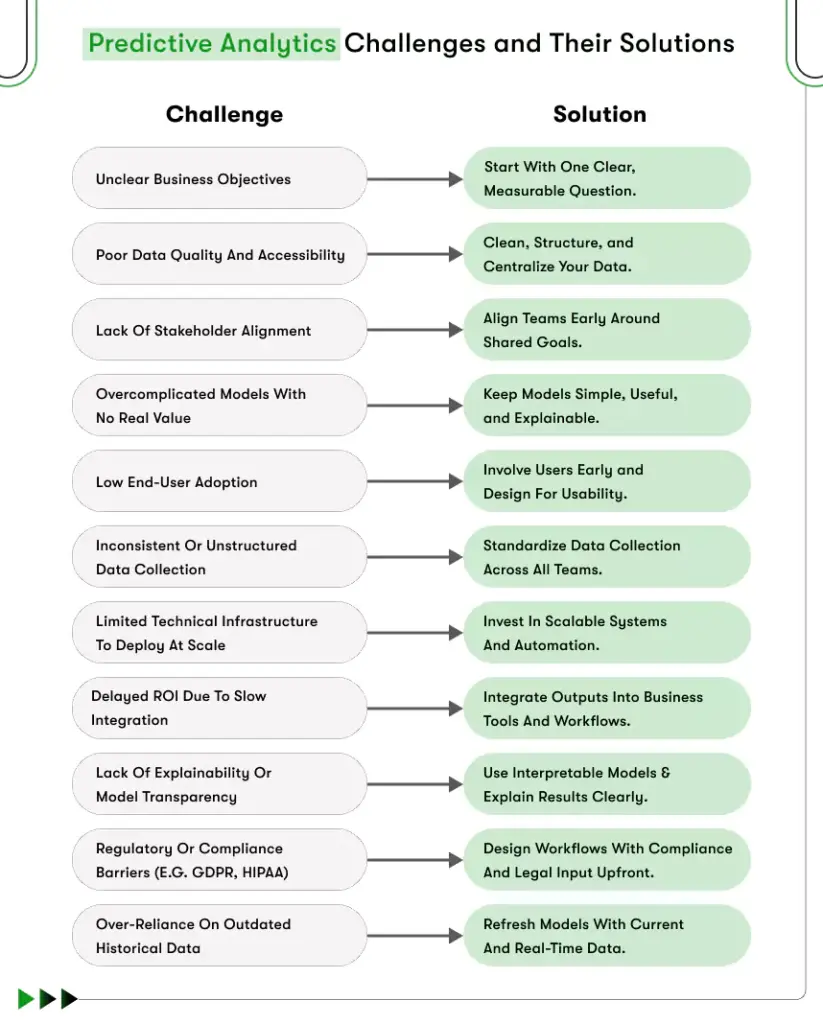
Image Source: Kody TechnoLab
Getting Started with Predictive Analytics
You don't have to think about starting large. Start with small actions.
First, prepare your data. Clean up the data to make it easier to understand. Using an email checker tool at this stage helps ensure your dataset is accurate before running predictive models.
Then, select basic tools tailored to your goals. Many platforms provide integrated analytical capabilities.
Select one use case at a time and focus only on its success, for example, lead scoring or timing of campaigns. Then you may scale to use cases further.
It is also important to train your employees. They must understand how to interpret data.
Real Impact on Client Results
Predictive analytics can create a real difference in client results when used correctly. Instead of relying on guesswork, agencies can make smarter marketing decisions based on actual client behavior and campaign data.
This leads to more targeted campaigns, better audience engagement, and improved budget allocation. Clients spend less on ineffective strategies and focus more on campaigns that are likely to deliver results.
Predictive analytics also helps agencies identify opportunities earlier. Whether it is finding high-converting leads, improving client retention, or choosing the right campaign timing, these insights can improve overall marketing performance.
When clients start seeing more consistent outcomes, they naturally gain greater confidence in the agency’s strategy. This helps build trust and creates stronger long-term relationships.
For agencies, predictive analytics can also become a competitive advantage. Agencies that use data-driven strategies are often able to deliver faster insights, better optimization, and stronger campaign performance compared to competitors still relying only on traditional marketing methods.
Using DashClicks Analytics Software for Predictive Marketing
Modern agencies need more than basic reporting tools. Platforms like DashClicks help agencies organize campaign data, monitor performance, and uncover patterns that support smarter marketing decisions.
With centralized dashboards and automated reporting, agencies can track metrics across multiple channels in one place. This makes it easier to identify trends, understand client behavior, and improve campaign forecasting.
DashClicks also simplifies data visualization, helping teams and clients clearly understand what is working and where adjustments are needed. Instead of manually collecting information from separate platforms, agencies can focus on optimizing campaigns using real-time insights.
For agencies beginning their predictive analytics journey, having a reliable analytics platform reduces complexity and improves decision-making. Better data organization leads to more accurate predictions, stronger targeting, and improved campaign performance over time.
How DashClicks Supports Predictive Analytics for Agencies?
Using tools like DashClicks can make predictive analytics easier for agencies.
Since predictive analytics depends heavily on organized data, agencies need a platform that helps track and manage marketing performance clearly. DashClicks’ marketing analytics software helps with this by offering:
- Centralized dashboards to monitor campaigns from different platforms in one place.
- Real-time reporting so agencies can quickly understand what is working and what needs improvement.
- Automated reports that save time and reduce manual work.
- Better campaign tracking to identify patterns in client behavior.
- Improved budget management by helping agencies focus more on high-performing campaigns.
- Easy-to-understand analytics that make client reporting simpler and clearer.
Instead of managing data from multiple tools separately, agencies can use DashClicks to keep everything organized. This makes it easier to make smarter marketing decisions and improve campaign performance over time.
Wrapping It Up
Predictive analysis isn't simply a fad but a valuable component of contemporary marketing practices. The firms that understand the process and adopt it stand to benefit greatly.
With predictive analytics, you get to shift your strategy from speculation to planning. You improve your ability to target, time, and increase effectiveness.
There's no need to complicate things. Start small, keep it simple, and gradually grow your efforts. Ultimately, it all boils down to one thing. Data analysis will give you an edge when making decisions.


15 Essential Landing Page Analytics to Track for Clients
Landing pages are one of the most crucial components of digital marketing campaigns. They serve as the first impression for potential customers, enticing them to act—whether signing up for a newsletter, purchasing a product, or scheduling a consultation. But how do you know if a landing page is doing its job? That's where landing page analytics come into play.
This post will guide you through the key performance indicators (KPIs) and analytics that every marketer should track to measure the effectiveness of a landing page, how to convert those numbers into actionable strategies, and how to create client-friendly reports that make a lasting impression.
What Are Landing Page Analytics?
Landing page analytics are the data points that help assess how effectively a landing page performs. The goal is to monitor various metrics that indicate how users interact with the page, how well the page converts traffic into leads or customers, and whether adjustments are needed to improve performance.
From bounce rates to scroll depth, landing page analytics offer powerful insights to guide data-driven decisions. For digital marketers, having a clear understanding of these metrics is essential to fine-tuning campaigns and boosting client satisfaction.
15 Metrics Every Marketer Should Focus On
When analyzing landing pages, specific analytics stand out as essential for understanding page performance. Here’s an overview of 15 key metrics you should focus on while evaluating a client's landing page.
1. Conversion Rate
The conversion rate is perhaps the most critical metric in evaluating the success of a landing page. The average landing page conversion rate is 9.7%. It calculates the percentage of visitors who complete a desired action, such as signing up for a newsletter, making a purchase, or filling out a contact form.

This metric serves as a clear indicator of how effectively the page is engaging its audience and driving them toward the intended goal. A high conversion rate suggests that the page's design, messaging, and overall user experience resonate well with its target audience, while a low conversion rate may point to areas that need improvement, such as unclear call-to-action, slow page loading times, or irrelevant content. Tracking and optimizing the conversion rate is essential for maximizing the effectiveness of any marketing campaign.
2. Average Time Spent on Page
This metric measures how long visitors stay on a landing page, providing valuable insights into user behavior. A longer time spent on the page generally indicates a higher level of engagement and interest in the content, suggesting that the page is effectively capturing the audience's attention. Conversely, a shorter time might signal a lack of relevance, poor design, or uninteresting content, highlighting areas that might need improvement.
3. Traffic Sources
Understanding where your landing page visitors are coming from—whether it’s search engines, social media platforms, paid advertisements, or email campaigns—is crucial for tailoring your marketing efforts effectively. By analyzing traffic sources, you can identify which channels are driving the most engagement, optimize your strategies for better performance, and allocate your resources more efficiently to maximize your results.
4. Bounce Rate
The bounce rate represents the percentage of visitors who leave a landing page without interacting, clicking, or taking any further action. A typical landing page bounce rate benchmark is 60-90%. It essentially measures how well your page engages users upon arrival.
A high bounce rate is often a red flag, indicating potential problems with usability, content relevancy, loading speed, or even the visual appeal of the page. It may suggest that the page isn’t meeting visitors’ expectations or providing what they’re looking for, making it an essential metric to monitor and improve.

Further Reading: 13 Tips to Reduce a Website's Bounce Rate and Increase Conversions
5. Scroll Depth
Scroll depth measures how far down a landing page users scroll, providing valuable insights into user engagement. It helps determine whether visitors are interacting with key sections of the page or skipping over important content. This metric is especially important for assessing whether critical information, such as product details or value propositions, and key call-to-action (CTA) elements are being seen. Over 90% of visitors who reported reading headlines also mentioned they read CTA copy. By analyzing scroll depth, you can optimize your page layout and ensure that essential content captures your audience’s attention.
6. Form Submission Rate
When your landing page includes a form, such as a lead capture form, its submission rate serves as a critical indicator of how compelling your offer, design, and overall user experience are. The average number of form fields is 11. However, reducing the number of form fields from 11 to 4 can lead to a 120% increase in conversions.
A high submission rate suggests that visitors find the content valuable and the process easy to complete, while a low rate may highlight issues with the form’s usability, the clarity of your message, or the appeal of your offer. Optimizing these elements can significantly improve conversions and help achieve your goals.
7. Click-Through Rate (CTR)
CTR, or Click-Through Rate, measures the percentage of visitors who click on specific Call-to-Actions (CTAs) on your website, emails, or ads. It’s a key metric for evaluating how well your content captures attention and drives engagement.

Tracking CTR allows you to understand the effectiveness of your hook, CTA copy, and overall messaging, helping you refine your strategy to better connect with your audience and encourage desired actions.
8. Mobile vs. Desktop Performance
With the rise of mobile usage, it’s essential to analyze how your landing page performs across different devices, especially smartphones and tablets. Only 50% of landing pages are optimized for mobile. A poorly optimized mobile page can result in slow loading times, difficult navigation, or misplaced elements, all of which can frustrate users and drive potential customers away. Ensuring a seamless mobile experience is key to keeping visitors engaged and converting them into loyal customers.
9. Exit Rate
The exit rate reveals the percentage of visitors who leave your website from the landing page or a specific page they were viewing. Nearly half of all website visitors, approximately 48%, leave the primary landing page without engaging further or exploring any marketing materials. This metric is crucial for understanding user behavior, as it highlights where and when visitors are dropping off. By analyzing the exit rate, you can diagnose potential bottlenecks, such as confusing navigation, slow loading times, or unengaging content, and take steps to improve the overall user experience.
10. Heatmaps
Heatmaps visually showcase areas of high user interaction on a webpage, such as buttons, images, or links, by using color-coded representations. Warmer colors like red and orange indicate areas with the most engagement, while cooler colors like blue highlight less interaction. They are a powerful tool for understanding user behavior, helping identify whether visitors are engaging with or ignoring key elements. This insight can guide design improvements, optimize layouts, and enhance the overall user experience.
11. Engagement Rate
This metric encompasses several factors, including clicks, scrolls, and time spent on the page, offering a comprehensive view of how users engage with your content.

By analyzing these behaviors, you can gain valuable insights into overall user activity, helping to identify trends, optimize the user experience, and make data-driven improvements to your website or application. Based on available data, the average engagement rate for landing pages ranges from 1% to 3.5%. However, most experts agree that an engagement rate exceeding 3.5% is considered "good."
12. Cost-per-Click (CPC) vs. Cost-per-Acquisition (CPA)
For paid campaigns driving traffic to a landing page, CPC (Cost Per Click) and CPA (Cost Per Acquisition) are key metrics that indicate how efficiently your budget is being spent. CPC helps you understand how much you’re paying for each click, while CPA measures the cost of acquiring a customer or lead. To optimize your campaign, it’s important to balance these costs against the value of the conversions generated, ensuring that your spending aligns with your overall marketing goals and delivers a strong return on investment.
Further Reading: Smart Strategies to Slash Your CPC With Landing Page Optimization
13. Page Load Speed
Slow-loading landing pages frustrate users, leading them to abandon your site before even exploring it. A delay of just a few seconds can significantly increase bounce rates and hurt your conversions. A one-second delay in load time can lead to a 7% reduction in conversions. Regularly track your page load times and optimize for speed, aiming to keep your landing page load time under 3 seconds to maintain user satisfaction and engagement.
14. A/B Test Results
Running A/B tests for different page elements, such as headlines, images, or CTA buttons, allows you to gather valuable data on what resonates best with your audience. By comparing two or more variations of a specific element, you can identify which version drives higher engagement or conversions. To ensure accurate results, use reliable analytics platforms to measure the performance of each version, tracking metrics like click-through rates, time spent on the page, or conversion rates. 44% of companies use A/B or split testing software. This data-driven approach helps you optimize your content and improve overall user experience.
Take a look at the infographic below to discover the ideal landing page layout and learn how to design your landing page for maximum engagement and conversions.

Image Source: KlientBoost
15. Returning vs. New Visitors
Understanding the ratio of returning visitors versus new visitors can reveal valuable patterns in user behavior, offering insights into how well your website or platform is engaging its audience. A high number of returning visitors may indicate strong loyalty and satisfaction, while a larger percentage of new visitors suggests successful outreach or marketing efforts. This information can help refine retargeting strategies, improve user retention efforts, and optimize content to better serve both existing and potential users.
Transforming Landing Page Data Into Actionable Change
While tracking metrics is essential, the real value lies in interpreting and acting on the data. Here’s how you can turn analytical insights into strategies that optimize your landing page:
- Diagnose Issues: If your bounce rate is high, review whether your landing page messaging is resonating or if your design feels cluttered.
- Optimize User Experience: Improve form submissions by minimizing required fields or adding social proof like customer testimonials.
- Personalize Content: Use analytics like traffic sources and device types to personalize page content for your audience.
How DashClicks SEO Services Can Help in Landing Page Optimization?
DashClicks' SEO agency platform are designed to enhance the performance of your landing pages by driving organic traffic and improving visibility in search engine results. By employing advanced keyword research, on-page optimization techniques, and quality content creation strategies, DashClicks ensures that your landing pages are tailored to meet the needs of your target audience. This not only boosts your search rankings but also increases the likelihood of attracting high-intent visitors.
Their team also focuses on technical SEO aspects, such as site speed, mobile friendliness, and structured data, to deliver a seamless user experience. With DashClicks' comprehensive approach to SEO, your landing pages can achieve better engagement, higher conversions, and sustained growth over time.
How To Build Tailored Landing Page Reports?
Creating detailed but digestible landing page reports for clients is essential for transparency and instilling confidence. Tools like DashClicks’ white label analytics software allow you to automate this process while offering customization options for in-depth tracking. Here's what you can do:
- Integrate Platforms: Combine data from multiple sources such as Google Analytics, Facebook Ads, or email platforms.
- Customize Visualization: Use graphs and tables to highlight trends, successes, and areas needing attention.
- Schedule Reports: Automate periodic reporting to save time and maintain consistent communication with your clients.
Best Practices for Creating Client-Impactful Reports
When presenting landing page metrics to clients, the way data is delivered can be just as important as the data itself. Effective reporting builds trust, aligns expectations, and proves your value as a digital marketer. By following these best practices, you can ensure your reports leave a lasting impact:
- Know Your Audience: Tailor your report to your client’s level of technical expertise. Some clients may prefer a high-level summary focused on ROI and key takeaways, while others may want a detailed breakdown of individual metrics. Always align your report's depth and style with the client’s preferences.
- Focus on Relevant Metrics: Avoid overwhelming clients with unnecessary data. Highlight the metrics that directly tie to their goals, such as conversion rates, sales generated, or traffic growth. Keeping the focus on actionable insights ensures the report stays clear and meaningful.
- Provide Valuable Context: Numbers alone don't tell the whole story. Contextualize your data by explaining trends, patterns, and their implications. For example, if the bounce rate improved after tweaking the page design, highlight this connection to showcase your impact.
- Use Visuals Effectively: Graphs, charts, and heatmaps are powerful tools for illustrating data trends and comparisons. Visuals not only make the report visually appealing but also help clients quickly grasp key points without sifting through walls of text. A fast way to get started is to use bar graphs. They are simple to create and easy to interpret.
- Keep it Concise and Structured: Organize the report in a logical flow, starting with an executive summary of results followed by detailed analyses. Use headings, bullet points, and short paragraphs to make content easy to skim for busy clients.
- Offer Clear Recommendations: Wrap up each section or report with actionable suggestions based on the data. Whether it’s optimizing CTAs, redesigning for mobile, or reallocating ad spend, providing actionable next steps demonstrates your commitment to improvement.
- Automate and Streamline: Use reporting tools like DashClicks’ Analytics Software to automate routine reports. This saves time and ensures accuracy while allowing more time to focus on strategizing rather than manual reporting.
By implementing these best practices, your reports will not only highlight landing page performance but also reinforce your role as a strategic partner in your client’s success.
DashClicks' Analytics Software for Tracking Metrics
DashClicks’ white label analytics platform offers a comprehensive solution for monitoring and evaluating key performance metrics across your landing pages. This intuitive platform integrates seamlessly with multiple data sources, providing a centralized dashboard to track crucial indicators like organic traffic, keyword rankings, conversion rates, and page performance.
Equipped with real-time analytics, the app enables you to identify trends and make data-driven decisions quickly. Its user-friendly interface includes customizable reporting options, ensuring clients can easily interpret results.
By leveraging the DashClicks’ Analytics Software, businesses can streamline their tracking processes, enhance transparency, and gain actionable insights tailored to their digital marketing goals.
Wrapping Up
Landing page analytics are more than just numbers—they’re powerful tools for optimizing performance and driving campaign success. By prioritizing key metrics like conversion rates, scroll depth, and engagement rates, marketers can hone their strategies, improve user experience, and build strong relationships with clients through evidence-based recommendations and insights.

A Guide to Tracking Revenue Generated from Leads
Understanding the revenue generated from leads is what will help you focus your marketing efforts and maximize your return on investment (ROI). By tracking how much income each lead brings in, you can make more informed decisions about where to allocate resources and which strategies are working.
This ensures your efforts are cost-effective and aligned with your business objectives. It also allows you to identify opportunities for improving your lead generation and conversion processes.
Accurate lead tracking will help you analyze customer behavior, identify high-performing channels, and refine your sales funnel. Uncover trends that impact your revenue streams and stay competitive and responsive in a fast-changing market.
What Are Leads and Why Are They Important?
A lead is a potential customer who has expressed interest in your product or service, often by engaging with your business through actions like signing up for a newsletter, downloading a resource, or filling out a contact form. Leads are the foundation of any successful sales funnel, as they represent opportunities to convert interest into revenue.
Leads are important because they allow businesses to identify and focus on individuals who are more likely to become paying customers. You can either purchase leads or generate them yourself by using tactics like cold outreach or ads. By nurturing these prospects through tailored communication and targeted strategies, companies can build relationships, foster trust, and guide them toward making a purchase.
Tracking and managing leads effectively ensures that your marketing and sales efforts are directed toward the most promising opportunities, ultimately driving growth and boosting your bottom line.
What Is the Lead-to-Revenue Framework?
The Lead-to-Revenue (L2R) Framework is a structured approach designed to align marketing and sales efforts with the ultimate goal of driving revenue. It encompasses every stage of the customer lifecycle, from initial lead generation to customer retention, ensuring a seamless transition between stages while optimizing performance at each point.
By implementing the L2R framework, businesses can create a cohesive strategy that bridges the gap between marketing and sales, fostering collaboration and maximizing results.
This framework focuses on defining clear processes, setting measurable objectives, and using data-driven insights to refine strategies continuously. Key components of the L2R framework include lead generation, lead nurturing, conversion, sales closure, and post-sale engagement.
It leverages technology, such as Customer Relationship Management (CRM) software and analytics tools, to track performance and provide actionable insights.
By adopting the Lead-to-Revenue Framework, businesses can enhance efficiency, reduce waste, and improve the predictability of revenue outcomes, ensuring a sustainable and scalable growth model.
Why Should You Track Revenue Figures for Leads?
Tracking revenue figures for leads provides crucial insights into the effectiveness of your marketing and sales efforts. By understanding which leads contribute the most to your bottom line, you can prioritize high-value opportunities and focus your resources on strategies that deliver tangible results.
This data-driven approach helps you eliminate underperforming campaigns, enabling you to save both time and money.
Furthermore, tracking revenue figures allows you to assess your customer acquisition cost (CAC) and customer lifetime value (LTV) ratios, key metrics for sustaining profitability. It ensures alignment between your lead generation efforts and overall business goals by providing a clear picture of what's working and what isn't.
Ultimately, this practice not only drives smarter decision-making but also empowers your team to scale more efficiently and optimize for long-term growth.
How to Establish a Lead-to-Revenue Framework in Your Business?
Establishing a Lead-to-Revenue (L2R) Framework in your business requires a strategic and systematic approach. Here are the key steps to help you implement this framework effectively:
1. Define Your Revenue Tracking Goals
Your first step is identifying what constitutes success for your business. Are you focusing on total revenue, average revenue per customer, or ROI for specific campaigns? Defining these objectives will help you establish clear benchmarks to evaluate your progress. These benchmarks ensure that your team remains focused and accountable.
A. Establish Metrics
Key performance indicators (KPIs) are essential for gauging lead quality and revenue generation. Common metrics include:
- Conversion rate from leads to customers: This metric measures the percentage of leads that successfully turn into paying customers. A high conversion rate indicates effective sales and marketing strategies, while a low rate highlights potential inefficiencies in your funnel.
- Customer lifetime value (CLV): CLV calculates the total revenue a business can expect from a single customer over their relationship. It's critical for identifying high-value customers and tailoring retention strategies to maximize long-term profitability.
- Cost per acquisition (CPA): CPA determines how much it costs to acquire a new customer. This metric helps evaluate the efficiency of your marketing campaigns and ensure you’re staying within budget while generating valuable leads.

Image Source: Clari
Tracking these metrics consistently provides a clearer picture of your lead performance and highlights areas for optimization. This data also helps in making data-driven decisions to improve outcomes.
Work closely with an accountant to track revenue generated from your campaigns and the percentage of your budget allocated to specific lead-generation strategies. Likewise, you should take the time to find a professional accountant who you can work closely with and analyze and re-evaluate your budgeting effectively.
B. Align Goals with Teams
Coordinate with your sales and marketing teams to ensure everyone is aligned. Miscommunication can lead to data silos, which hinder accurate tracking. Regular team meetings and updates can foster collaboration and prevent inefficiencies in your tracking process.
2. Set Up a Reliable Lead Tracking System
A customer relationship management (CRM) tool centralizes your data and makes tracking seamless. Look for a CRM that integrates with your marketing platforms and provides revenue attribution features. A robust CRM also enables better communication among team members and enhances overall efficiency.
A. Implement UTM Parameters
UTM tracking links are invaluable for understanding which campaigns drive the most revenue. Use them consistently across your ads, emails, and social media posts. Properly tagged links ensure that you can measure the performance of individual marketing activities with precision.
B. Automate Lead Attribution
Automation tools help minimize manual errors. Use software that assigns revenue to specific leads based on predefined rules or multi-touch attribution models. Automated attribution also saves time and provides more reliable insights, allowing you to focus on strategy rather than administrative tasks.
Actionable Steps to Implement Your System:
- Evaluate CRM options like DashClicks’ Contacts Management Software.
- Use URL builders to create UTM parameters for all campaigns.
- Integrate your CRM with marketing and analytics tools.
- Regularly audit your system to ensure data accuracy and functionality.
3. Monitor Lead Behavior and Revenue Patterns
Knowing where your leads come from helps you understand which channels deliver the highest ROI. Categorize leads by origin, such as organic search, paid ads, or referrals. This categorization enables you to allocate resources more effectively to top-performing channels.
A. Analyze Revenue Trends
Identify patterns in revenue generation, such as seasonal spikes or high-performing product categories. Using bank statement extraction software can help identify these patterns by analyzing financial data more effectively. This allows you to make informed decisions about where to focus your efforts for maximum impact.
This data informs budget adjustments and strategic decisions. Analyzing these trends also helps you anticipate market changes and prepare proactive strategies.
B. Segment Leads by Value
Not all leads are created equal. Use your CRM to segment leads based on their revenue potential, allowing you to prioritize high-value prospects. Segmentation ensures you allocate time and resources efficiently to maximize conversions and revenue.

Image Source: Medium
4. Optimize Your Sales Funnel
Examine each stage of your sales funnel to identify drop-off points. Are you losing leads during initial contact, follow-ups, or post-purchase engagement? Addressing these weaknesses can significantly boost overall conversion rates and revenue.
A. Personalize Engagement
Tailor your communication based on lead behavior and preferences—personalized emails, product recommendations, and exclusive offers boost conversion rates and revenue.
Reaping the benefits of invoice factoring can help your business maintain cash flow, ensuring you have the resources needed to execute these personalized strategies effectively. This approach also builds stronger relationships with your customers, enhancing brand loyalty.
B. Steps to Enhance Funnel Performance:
- Use heatmaps and analytics to identify weak points in your funnel.
- A/B test your landing pages, email campaigns, and ad creatives.
- Train your sales team on best practices for lead nurturing.
- Regularly review and update your funnel strategies to align with evolving customer needs.
C. Track Funnel Impact
Measure the revenue generated at each funnel stage. This granular approach helps identify where improvements yield the highest returns. Detailed tracking ensures that every part of your funnel contributes effectively to your revenue goals.
5. Use Analytics to Refine Strategies
Analytics dashboards make it easier to spot trends and anomalies. Tools like Google Analytics, Power BI, or Tableau simplify this process and provide actionable insights.
These platforms enable you to drill down into specific metrics, ensuring a detailed understanding of your revenue patterns. Visualizing data also helps communicate findings clearly to stakeholders, enabling faster decision-making and fostering more informed strategic planning.
A. Test and Iterate
Continuously test your strategies to improve lead-tracking accuracy. Small tweaks, such as changing call-to-action phrasing or targeting a new audience segment, can significantly impact revenue.
Regular testing helps you identify what resonates most with your target audience. Iterative testing fosters innovation and keeps your approach dynamic and effective, ensuring you stay ahead of market changes.
B. Share Insights With Stakeholders
Present your findings to your team or clients through clear, data-driven reports. This ensures everyone understands the impact of lead tracking on revenue growth.
Visualizing this data with charts or graphs can make complex information more accessible. Sharing insights fosters collaboration and aligns all departments toward shared objectives, driving a more unified and effective strategy.
Leverage DashClicks White Label Reporting Tool for Enhanced Insights
The white label reporting software by DashClicks serves as a powerful tool to streamline and optimize your lead tracking and revenue attribution processes. This app centralizes crucial data, providing an intuitive dashboard where you can track performance metrics such as conversion rates, customer lifetime value (CLV), and cost per acquisition (CPA) in real-time.
By integrating seamlessly with your CRM and marketing platforms, the marketing reporting software ensures that your team has access to accurate, actionable insights.
Additionally, the app offers customizable reporting options, enabling you to visualize data clearly and share it effectively with stakeholders. Its cutting-edge analytics features help pinpoint underperforming campaigns, identify high-value segments, and refine your strategies to maximize ROI.
Whether you are uncovering trends or identifying bottlenecks in your funnel, the DashClicks Analytics App equips you with the tools needed to fine-tune your approach and drive sustainable revenue growth for your business.
6. Analyzing Revenue Generation
Analyzing revenue generation is a fundamental step in understanding the financial health of your business and identifying opportunities for growth. By examining how revenue is produced across different channels, products, and customer segments, you gain actionable insights that drive strategic decisions.
Start by evaluating your top-performing revenue channels—whether it's organic search, email marketing, paid ads, or referrals. These insights help you allocate resources effectively to maximize ROI.
A. Evaluate Revenue Sources
Break down your revenue by source and category to identify the most profitable areas. Determine which marketing activities have the greatest impact on customer acquisition and retention. For instance, if social media campaigns generate steady revenue growth, consider amplifying those efforts.
B. Identify High-Performing Products
Review product-specific sales to uncover which items contribute the most to your bottom line. These insights can inform inventory management, promotional strategies, and product development initiatives to capitalize on customer demand. Leveraging advanced inventory forecasting tools can further enhance this process by accurately predicting demand patterns. This ensures optimal stock levels, reduces excess inventory, and improves overall efficiency in meeting customer needs.
C. Segment Revenue by Customer Groups
Segmenting revenue by demographics or behaviors allows you to effectively target your highest-value customers. For example, identifying trends among repeat buyers or high-spending clients can help tailor your upselling and loyalty programs.
D. Leverage Financial Data
Use tools like financial dashboards and data visualization to track progress and highlight revenue trends over time. Platforms such as Power BI or Tableau enable you to analyze key metrics with interactive dashboards, offering a comprehensive view of how revenue is generated and where improvements can be made.
Regular analysis of your revenue generation process ensures that your strategies remain data-driven and adaptable to market shifts. This proactive approach sets the foundation for continuous growth and profitability.
7. Implementing Improvements
Once you've identified areas that need improvement within your lead-to-revenue framework, the next step is to implement actionable changes that drive meaningful results. These improvements should be tailored to address inefficiencies, optimize processes, and enhance overall performance across all stages of your framework.
A. Reevaluate and Streamline Processes
Begin by conducting a thorough review of your existing workflows. Identify bottlenecks or redundancies in your sales and marketing efforts. Automate repetitive tasks where possible, such as email follow-ups or lead assignment, using tools like marketing automation platforms or enhanced CRM features. Streamlining processes not only increases efficiency but also allows your team to focus on high-impact activities.
B. Focus on High-Value Opportunities
Use data from your analysis to prioritize high-value leads and customers. Develop targeted strategies for nurturing these opportunities, such as personalized email campaigns, tailored product recommendations, or exclusive offers for key segments. Focusing on high-potential prospects ensures you allocate resources effectively, maximizing conversions and revenue.
C. Enhance Collaboration Between Teams
Misalignment between marketing and sales teams is a common barrier to achieving optimal results. Foster better communication by scheduling regular meetings to discuss shared goals, review progress, and address challenges. Consider using integrated platforms that provide both teams with real-time access to shared data, ensuring alignment in targeting and strategy execution.
D. Refine Messaging and Content
Analyze the effectiveness of your current messaging and content strategy. Are your messages resonating with your target audience? If not, make necessary adjustments based on customer feedback or performance metrics. Refresh your content assets—like landing pages, ad creatives, and email templates—to better reflect evolving customer needs and preferences. A/B testing can further refine these changes, helping you identify the most effective approaches.
E. Measure the Impact of Changes
After implementing improvements, monitor performance closely to ensure the desired outcomes are achieved. Use analytics tools to track the impact of your changes on key metrics like conversion rates, lead quality, and revenue growth. Comparing performance before and after adjustments helps validate your strategies and informs further refinements.
F. Create a Continuous Improvement Plan
Improvements are not a one-time task but require ongoing attention. Establish a plan for regular reviews of your lead-to-revenue framework to ensure it remains effective and adaptable to changing market dynamics. Continuously test new ideas, gather feedback, and make adjustments as needed to stay ahead of industry trends and maintain a competitive edge.
By focusing on these practical steps, you can optimize your framework and create a scalable, high-performance system that drives consistent revenue growth.
Conclusion
Tracking revenue generated from leads requires clear goals, the right tools, and consistent monitoring. By aligning your efforts across teams and leveraging data-driven insights, you can maximize revenue and streamline your marketing efforts. This level of clarity allows you to make smarter investments and avoid wasting resources on low-performing strategies.
This process not only improves profitability but also deepens your understanding of what drives customer value. Start tracking today to ensure you’re investing in strategies that deliver measurable returns. Staying proactive in refining your tracking methods can give you a competitive edge in the market.

10 Tips That Transform Data into Actionable Marketing Metrics
In today's data-driven marketing environment, simply collecting data isn't enough. The real value lies in translating this wealth of information into actionable insights that can guide your marketing strategy and drive measurable results.
However, for many marketers, the leap from raw data to actionable marketing metrics can seem like a daunting task.
That’s why we’ve compiled these 10 essential tips to help you bridge the gap and turn data into insights that empower your decision-making process.
1. Define Clear Objectives
Before delving into the data, it's crucial to establish what you're aiming to achieve with your marketing efforts. Clear objectives not only guide your analysis but also ensure that the insights you derive are relevant and actionable.
Begin by asking what key performance indicators (KPIs) matter most to your business. Is it customer acquisition cost, lifetime value, conversion rate, or something else?
Identifying these goals early on will help you focus on the data that matters most and avoid getting lost in irrelevant details.

2. Understand Your Data Sources
Not all data is created equal. To make informed decisions, it’s vital to understand both the origin of your data and the quality of each source. This understanding is crucial because it helps discern valuable insights from mere noise. Teams often modernize their data collection and AI pipelines to unify inputs and improve data quality.
By analyzing data from a diverse range of sources, including website analytics that tracks visitor behavior, social media engagement that reflects brand interaction, email marketing reports that measure campaign effectiveness, and direct customer feedback that offers unfiltered opinions, you can gain a comprehensive view of your marketing performance.
This holistic approach allows you to identify areas of success as well as opportunities for improvement, ensuring that your marketing strategies are data-driven and optimized for the best possible outcomes.
3. Segment Your Data
Data segmentation is a powerful analytical tool that lets you divide your overarching data into smaller, more manageable chunks.
This division is typically based on specific criteria, like demographic information (age, gender, location), customer behavior (browsing habits, product preferences), or purchase history (frequency of purchases, average spend).
By segmenting data in this manner, it becomes significantly easier to analyze distinct patterns and trends within these subsets. This detailed analysis can then inform targeted marketing strategies, allowing businesses to tailor their approach to meet the specific needs and preferences of different customer segments.
As a result, companies can achieve more effective engagement, improved customer satisfaction, and higher conversion rates.
4. Focus on Key Performance Indicators (KPIs)
To effectively track and measure the success of your business efforts, it is crucial to identify which key performance indicators (KPIs) align most closely with your strategic objectives. By zeroing in on these specific KPIs, you can more accurately gauge your progress and focus on the metrics that genuinely impact your business's bottom line.
This targeted approach allows for a more efficient allocation of resources, ensuring that you are investing time and effort into areas that yield the most significant returns.
Among the myriad of metrics available, certain KPIs stand out for their direct correlation to business success. Conversion rates, for example, provide insight into the effectiveness of your marketing and sales strategies, indicating how well you're turning prospects into paying customers.
Customer acquisition costs offer a clear picture of the efficiency of your marketing efforts, revealing the total expense involved in attracting each new customer. Meanwhile, the average order value is a critical metric for understanding customer purchasing behavior, helping you to strategize ways to increase the overall value of transactions.
By carefully selecting and monitoring these and other relevant KPIs, businesses can refine their strategies, improve performance, and achieve their objectives with greater precision.

Image Source: Databox
5. Use Visuals to Interpret Data
A crucial step in transforming data into actionable insights is the use of visual aids. Graphs, charts, and infographics can make complex information more accessible and easier to understand.
Visual representations help to quickly spot trends, patterns, and anomalies in your data, which might be missed in traditional reports or spreadsheets. For instance, a well-designed infographic can summarize your marketing campaign's performance across different metrics, while a line chart could reveal the growth trends in your customer acquisition over time.
By incorporating visuals into your data analytics strategy, you not only enhance comprehension among your team but also facilitate more informed decision-making processes. This approach allows stakeholders of all levels to engage with the data meaningfully, fostering a data-centric culture within your organization.
6. Leverage Predictive Analytics
Predictive analytics stands out as a forward-thinking tool in the realm of data-driven marketing. By harnessing historical data and applying statistical algorithms and machine learning techniques, businesses can forecast future trends, customer behaviors, and potential market shifts with greater accuracy.
This approach not only anticipates what customers might do next but also identifies new opportunities and potential risks before they become evident.
Utilizing predictive analytics can dramatically enhance decision-making capabilities, enabling marketers to craft strategies that are not just reactive but proactively aligned with anticipated changes in consumer preferences and industry dynamics.

Image Source: Adjust
For example, by predicting which products are likely to become popular in the coming months, companies can adjust their inventory levels, marketing campaigns, and pricing strategies ahead of time, ensuring they remain competitive and meet customer demand effectively.
Incorporating predictive analytics into your marketing efforts requires a solid foundation of quality data, advanced analytics capabilities, and an ongoing commitment to refining your models as more data becomes available. For marketers looking to build these skills from the ground up, enrolling in a Tripleten data analytics course can provide the technical knowledge needed to apply predictive models confidently. This effort, however, pays off by keeping your business ahead of the curve, driving efficiency, and maximizing ROI on your marketing initiatives.
7. Perform Regular Audits
An essential habit for effectively using data in marketing is performing regular audits on your data collection and analysis processes. An essential habit for effectively using data in marketing is performing regular audits on your data collection and analysis processes. Some marketers rely on data scraping services to gather additional publicly available information, ensuring their data is accurate and relevant.
By systematically reviewing your data sources, collection methods, and the insights derived from them, you can identify any discrepancies, outdated information, or areas of bias that may skew your analysis.
Regular data audits also provide the opportunity to spot new trends or changes in consumer behavior early on, allowing for timely adjustments to your marketing strategies. Additionally, these audits encourage adherence to data governance and compliance standards, ensuring your marketing practices remain ethical and legally sound.
Implementing a routine schedule for these audits will foster a culture of continuous improvement and accountability within your marketing team, ultimately leading to more strategic and successful data-driven decisions.
8. Implement A/B Testing
A pivotal strategy in refining marketing efforts and enhancing data accuracy is the implementation of A/B testing. This method involves comparing two versions of a marketing asset (such as a webpage, email campaign, or social media ad) to determine which one performs better on a specific conversion goal.
By systematically testing variations in design, messaging, or timing, marketers can gather empirical evidence about what strategies are most effective with their target audience.
A/B testing not only clarifies which elements contribute to higher engagement and conversion rates but also allows for a more nuanced understanding of customer preferences and behavior.
This informed approach leads to more personalized and efficient marketing strategies. Over time, the cumulative effect of these optimizations can significantly enhance marketing ROI.
To facilitate A/B testing, it's crucial to start with a clear hypothesis, define success metrics clearly, and ensure that tests are run for a sufficient duration to collect actionable data.
Incorporating A/B testing into your regular marketing workflow can transform how you make decisions, moving from intuition-based to data-driven strategies.

9. Encourage Cross-departmental Collaboration
Cross-departmental collaboration is crucial in transforming data into actionable marketing metrics. When departments such as IT, sales, customer service, and marketing work together, they can provide a more holistic view of the customer experience and a comprehensive dataset that spans various touchpoints.
This collaboration allows for a richer interpretation of data, leading to insights that might not be evident when departments work in silos.
For instance, integrating customer feedback from the service department with sales data and marketing analytics can unveil patterns in customer behavior and preferences, informing targeted marketing strategies that might increase customer satisfaction and loyalty.
Additionally, working closely with the IT department can ensure that the technology platforms used are the best fit for the analyses needed, improving the quality of data collected.
Encouraging cross-departmental teams to share knowledge and insights can lead to a more cohesive understanding of business operations and customer needs. It fosters a culture of continuous learning and improvement, where data-driven insights inform strategies across the organization, driving overall business success.
10. Act on Your Insights
The final and most crucial step in transforming data into actionable marketing metrics is to take decisive action based on the insights gained. Understanding what the data tells you is only part of the equation; the real value comes from implementing changes that can drive positive results for your business.
Whether it's refining your marketing campaigns, adjusting your product offerings, or enhancing customer experiences, acting on your insights is what ultimately differentiates successful businesses from the rest.
Initiating changes based on data-driven insights should be approached with precision and adaptability. Start with small, manageable adjustments to ensure their impact can be accurately measured and learned from.
This iterative approach allows you to test the effectiveness of your changes and refine your strategy over time. Key to this process is maintaining a loop of feedback and learning, where the results of your actions inform future decisions, creating a culture of continuous improvement and innovation.
By acting on your insights, your business doesn't just respond to current trends and customer behaviors but anticipates and shapes the future of your market presence. This proactive stance enables you to stay ahead of the competition, foster customer loyalty, and drive sustainable growth.
Pro Tip: Leverage DashClicks Analytics App
In the realm of data-driven marketing, the Analytics software by DashClicks emerges as a powerful tool designed to streamline the analysis and interpretation of marketing data.
This comprehensive platform offers an intuitive interface that allows marketers to monitor key performance indicators (KPIs), track marketing campaign effectiveness, and gain insights into customer behavior across various channels.
With the white label analytics software, businesses can consolidate data from multiple sources, providing a unified view that facilitates a deeper understanding of marketing dynamics.
This software empowers users to not only visualize data through customizable dashboards and reports but also leverage advanced analytics features to identify trends, patterns, and opportunities for optimization.
By utilizing marketing analytics software, companies can make informed decisions more swiftly, adjust their marketing strategies in real-time, and enhance ROI by precisely targeting their efforts based on actionable insights.
It stands as a testament to how technology can augment the capability of businesses to act on data-driven insights, ensuring they remain agile and competitive in a rapidly evolving digital landscape.
Conclusion
By implementing these 10 tips, you can transform overwhelming data into actionable marketing metrics that drive strategy, optimize campaigns, and ultimately, contribute to achieving your business objectives.
Moving from data collection to actionable insights requires effort and a strategic approach, but the rewards in terms of improved marketing performance and ROI are invaluable.
In the realm of digital marketing, understanding how to effectively harness and apply insights from your marketing metrics can position your brand ahead of the competition. Start turning your data into actionable insights today, and watch your marketing strategy unfold with a new level of precision and effectiveness.


12 Tips for Developing a Successful Data Analytics Strategy
Welcome to the data-driven era, where the power of data analytics is not just a luxury it's a necessity for gaining a competitive edge. With the right data analytics strategy, businesses can unlock the potential to make informed decisions, predict future trends, and boost operational efficiency like never before.
However, the journey to developing an impactful data analytics strategy goes beyond just investing in the latest AI and big data technologies. It requires a deep alignment of data initiatives with the company's core business objectives.
In this blog post, we'll dive into 12 essential tips that will set you on the path to crafting a data analytics strategy destined for success. Stay tuned!
Why Is Having a Data Analytics Strategy Important for any Business?
In the modern marketplace, where data is a crucial asset, having a well-defined data analytics strategy is paramount for any business aiming to thrive. Here's why:
- Informed Decision-Making: Data analytics provides deep insights into market trends, customer behaviors, and operational efficiencies, allowing businesses to make decisions based on hard evidence rather than intuition.
- Competitive Advantage: Leveraging analytics helps businesses understand their market position better, identify new opportunities, and respond to competitors' strategies with agility.
- Enhanced Customer Experience: By analyzing customer data, businesses can tailor their products, services, and interactions to meet the evolving needs of their target audience, fostering loyalty and satisfaction.
- Operational Efficiency: Data analytics can streamline operations, reduce costs, and improve productivity by identifying inefficiencies and optimizing processes.
- Risk Management: Analyzing historical and current data enables businesses to identify potential risks and develop strategies to mitigate them, safeguarding the company’s future. In industries like online insurance and traditional insurance, leveraging data analytics in insurance claims can streamline claims processing, detect fraud, and improve decision-making by providing real-time insights into risk assessment and policyholder behavior. Similarly, in the life settlement market, data analytics plays a crucial role in evaluating policy values, mortality assessments, and market trends to make informed investment decisions while managing portfolio risks.
- Innovation and Growth: Utilizing data analytics to its full potential can uncover new avenues for innovation and expansion by revealing market gaps and customer needs that haven't been addressed.
- Data-Driven Culture: A solid data analytics strategy fosters a culture that values evidence-based decision-making, encouraging teams across the organization to leverage data in their daily tasks.

Image Source: Databox
In essence, a comprehensive data analytics strategy is not merely a nice-to-have but a fundamental component of a modern business’s toolkit to ensure sustainable growth and success in an increasingly data-centric world.
Tips For Crafting the Perfect Data Analytics Strategy
Crafting an impeccable data analytics strategy involves more than just collecting and analyzing data.
It's about creating a blueprint that seamlessly integrates data into the fabric of your organization, making it a central pillar for decision-making. To embark on this journey, it's crucial to approach your strategy with a clear plan and purpose.
The following tips aim to guide you through the foundational steps needed to engineer a data analytics strategy that not only aligns with your business objectives but also empowers your team to uncover actionable insights.
1. Start With Your Business Objectives
The first and foremost step in developing a successful data analytics strategy is to align it with your core business objectives. Understanding what you aim to achieve as a business is crucial.
Are you looking to enhance customer satisfaction, increase operational efficiency, drive revenue growth, or stay ahead of the competition? By clearly defining your business goals, you can tailor your data analytics efforts to support these objectives, ensuring every analysis performed and insight gained directly contributes to your strategic aims.
This alignment not only helps in prioritizing data projects but also in measuring the impact of your analytics initiatives against real business outcomes.
2. Cross-Functional Team Collaboration
Engaging cross-functional teams in your data analytics initiatives is crucial for achieving a comprehensive understanding and application of data across the organization.
Collaboration between departments such as IT, marketing, sales, and operations ensures that data insights are not siloed but are utilized to their fullest potential to drive business growth.
This approach fosters a culture of data-driven decision-making, where diverse perspectives and expertise contribute to the refinement and success of your data analytics strategy.
Encourage regular meetings, workshops, and shared projects to facilitate communication and knowledge exchange between teams.
By leveraging the strengths and insights of various departments, you can create a more nuanced and effective analytics strategy that aligns with both the broad objectives and specific needs of your organization.
3. Data Quality Is Non-Negotiable
Ensuring the quality of your data is the bedrock upon which all reliable analysis stands. Inaccurate, incomplete, or irrelevant data can lead to misguided decisions that might harm your business.
Understanding the intricacies of data quality is essential, yet harnessing actionable insights from financial reports is crucial for deeper organizational success. Analyzing P&L reports alongside cash flow and balance sheets can unveil vital signs of your business's financial health, ensuring alignment with strategic objectives. Incorporate these elements into your analytics strategy to optimize financial reporting effectiveness.
Implement rigorous processes for data collection, verification, and cleaning to maintain the integrity of your data. It's crucial to establish strict data governance practices that define the standards for data quality, data access, and data privacy within your organization.
Regular audits and updates of these practices will help keep your data relevant, allowing your analytics to produce trustworthy and actionable insights. Remember, the success of your data analytics strategy heavily relies on the quality of the data at your disposal, making it imperative to prioritize data quality above all else.

Image Source: TechTarget
4. Adopt the Right Tools and Technologies
Selecting the appropriate tools and technologies is critical for the execution of a successful data analytics strategy. The landscape of data analytics tools is vast, ranging from data warehousing and business intelligence platforms to advanced analytics and machine learning software.
Your choice should be guided by your specific business needs, the complexity of data analyses required, and the scalability of solutions. It’s important to consider data analytics software that integrates well with existing systems and can adapt to future needs. Additionally, investing in training for your team to effectively utilize these tools is essential.
By carefully choosing and mastering the right technologies, you can significantly enhance your ability to extract meaningful insights from your data, driving innovation and competitive advantage.
5. Balance Centralization and Decentralization
Striking the right balance between centralizing and decentralizing your data analytics capabilities is key to maximizing efficiency and flexibility. Centralization brings the advantage of standardization, reducing redundancy and ensuring consistency in data handling and analysis across the organization.
This model fosters the development of a unified analytics strategy that aligns with core business objectives. On the other hand, decentralization allows individual departments or teams to quickly respond to their specific needs and challenges, encouraging innovation and agility.

Image Source: ResearchGate
The optimal approach often involves a hybrid model, where a central data team establishes company-wide analytics standards and governance, while individual departments have the autonomy to execute their own analytics projects within this framework.
This balance ensures that while the organization benefits from standardization in data management and analysis, it also retains the ability to adapt rapidly to changing market demands and internal requirements.
6. Cultivate Data Literacy
Cultivating data literacy across your organization is essential for the success of your data analytics strategy. Data literacy refers to the ability to read, understand, create, and communicate data as information.
It's crucial that not just data specialists, but everyone in the organization has a basic understanding of data analytics principles and the competence to use data in their daily decisions.
This fosters a culture where data-driven insights become a regular part of decision-making processes across all levels. To achieve this, offer regular training sessions, workshops, and resources that help employees improve their data skills. Additionally, creating a data glossary can help standardize data terminology across your organization, making it easier for team members to understand and communicate about data.
By prioritizing data literacy, you empower every employee to contribute more effectively to your organization's data-driven objectives, enhancing overall performance and innovation.
7. Prioritize Data Security and Compliance
Prioritizing data security and compliance is not just important; it's imperative for the protection of your business and the trust of your customers. One effective strategy is understanding what a VPN is and how it can protect your organization by securing your internet traffic against threats.. A robust data analytics strategy must include comprehensive measures to safeguard sensitive information from unauthorized access, breaches, and leaks. Utilizing the best VPN service can further enhance your data security by encrypting internet connections and preventing unauthorized access.
Establishing strict data security protocols, adhering to industry standards, and ensuring compliance with global data protection regulations, such as GDPR in Europe and CCPA in California, are crucial steps. Additionally, regular security audits and employee training on data handling best practices can significantly reduce the risk of data breaches.
By making data security and compliance core elements of your data analytics strategy, you not only protect your company’s assets but also reinforce your commitment to ethical data governance, building trust with your customers and stakeholders.

Image Source: Microsoft
8. Be Agile with Experimentation
In the fast-paced world of data analytics, adopting an agile approach to experimentation is crucial. Being agile allows businesses to test hypotheses and adapt strategies quickly based on real-world data and outcomes. This involves setting up a framework that supports rapid iteration and experimentation of your data analytics projects.
Encourage your team to pilot new analytics tools, explore diverse data sources, and apply novel analytical techniques with the understanding that not every experiment will lead to success.
However, even failed experiments are valuable, as they provide insight into what doesn't work and why, helping to refine future strategies. Establishing a culture that celebrates experimentation and learning from failure fosters innovation and can lead to breakthrough analytics solutions that significantly impact your business.
Remember, agility in experimentation is not about recklessness but about being responsive, adaptive, and open to exploring new avenues for growth and improvement.
9. Look Beyond Historical Reporting
Shifting the focus beyond mere historical reporting to predictive analytics and prescriptive analytics is a critical step in maturing your data analytics strategy. Historical data provides insights into what has happened in the past, but leveraging advanced analytics can help you forecast future trends and determine how to best respond to those predictions.
Predictive analytics uses historical data to identify patterns and predict future outcomes, while prescriptive analytics goes a step further by recommending actions you can take to achieve desired outcomes or mitigate risks. This forward-looking approach enables businesses to anticipate market changes, customer needs, and potential challenges before they occur, offering a significant competitive advantage.
Implementing such analytics requires not only the right tools and technologies but also a willingness to invest in the necessary skills and processes within your organization. By adopting a strategy that includes predictive and prescriptive analytics, businesses can transform data into actionable intelligence, driving proactive decision-making and strategic planning.
10. Measure and Communicate ROI
The ultimate measure of a successful data analytics strategy is its return on investment (ROI). Demonstrating the financial and operational benefits of your analytics initiatives is crucial for justifying the expenditure of resources and for continuing support from stakeholders.
To effectively measure and communicate ROI, start by establishing clear metrics that link data analytics efforts directly to business outcomes. These can include increased revenue, cost savings, customer satisfaction improvements, or efficiency gains. Utilize these metrics to track performance over time and calculate the tangible benefits derived from your analytics activities.
Additionally, it's important to communicate these results in a clear and compelling manner to stakeholders across the organization. Utilize visualizations and stories to highlight key successes and learnings. Showing how data analytics drives value not only reinforces the importance of existing initiatives but also builds a case for future investments in data and analytics. Remember, transparent and consistent communication about the wins, challenges, and the ongoing value of data analytics will foster a stronger, data-driven culture within your organization.
11. Foster a Data-Driven Culture
Establishing a data-driven culture is paramount for the successful implementation of a data analytics strategy. This culture encourages the use of data in every decision-making process, ensuring that intuition or guesswork is replaced with data-backed evidence.
To foster a data-driven culture, leadership must lead by example, demonstrating a commitment to data-driven decisions at all levels. In addition, promoting open access to data and analytics tools across the organization empowers employees to seek out data insights for their projects and decisions.
Creating forums for sharing success stories and lessons learned from data analytics projects can also inspire and educate team members about the value of data. Regular training programs, accessible analytics tools, and support systems are necessary to equip employees with the skills to interpret and apply data insights.
By embedding data analytics into the DNA of the organization, companies can enhance decision-making, increase operational efficiency, and sustain a competitive edge in their industry.

Image Source: GoodData
Fostering a data-driven culture is not an overnight task; it requires continuous effort, leadership support, and strategic planning to integrate data into every aspect of the organization's operations and ethos.
12. Stay Updated and Evolve
In the dynamic field of data analytics, staying updated with the latest trends, tools, and methodologies is crucial for maintaining a competitive edge. The landscape of data analysis is constantly evolving, driven by rapid technological advancements and changing market demands.
Organizations must commit to ongoing learning and adaptation to remain relevant. This involves not only keeping abreast of industry news and advancements but also continuously evaluating and updating the analytics tools and processes in use.
Encourage your team to participate in relevant workshops, webinars, and conferences, and to engage with professional networks and forums where they can exchange knowledge and learn from peers.
Furthermore, foster an organizational culture that values curiosity and innovation, allowing your team the freedom to explore new ideas and approaches in data analytics.
By staying informed and adaptable, you can ensure that your data analytics strategy is always aligned with the latest industry standards and best practices, thereby maximizing its effectiveness and driving sustained growth and success for your business.
Incorporating white label analytics software by DashClicks into your data analytics strategy can significantly enhance your ability to glean insights and drive business growth. DashClicks is renowned for its user-friendly interface and comprehensive features, designed to simplify the complex process of data analysis.
It offers real-time analytics, customizable dashboards, and integrative functions that can consolidate data from various sources, offering a holistic view of your business performance. By leveraging the software, organizations can access powerful analytics capabilities without the need for extensive technical expertise.
This accessibility ensures that data-driven decision-making is not just confined to data scientists but can be embraced across the organization, aligning with the goal of fostering a data-driven culture.
Additionally, the white label reporting software provides robust support and continuous updates, ensuring your analytics tools remain at the cutting edge of technology and best practices. Integrating the software into your strategy can be a game-changer, offering scalable solutions that adapt to your evolving business needs and objectives.
Conclusion
In conclusion, the successful implementation of a data analytics strategy is multi-faceted, requiring a blend of technology, people, and processes.
From prioritizing data quality and security to fostering a data-driven culture and staying agile with experimentation, each aspect plays a pivotal role in unlocking the full potential of data analytics. The path to a robust analytics framework involves continuous learning, adaptation, and a willingness to experiment.
By focusing on these key strategies, businesses can enhance their decision-making processes, drive innovation, and maintain a competitive edge in the rapidly evolving digital landscape. It's important to remember that building a successful data analytics strategy is not a one-time effort but an ongoing process that evolves with your business needs and the technological advancements in data analysis.
With a clear focus on these foundational elements, organizations can leverage data analytics to achieve remarkable efficiency gains, uncover new opportunities, and ultimately, realize significant returns on their investments.


No results found.
Please try different keywords.
Get Started with
DashClicks Today
Get found online, convert leads faster, generate more revenue, and improve your reputation with our all-in-one platform.
.svg)
Unlimited Sub-Accounts
Unlimited Users
All Apps
All Features
White-Labeled
Active Community
Mobile App
Live Support
100+ Tutorials
Unlimited Sub-Accounts
Unlimited Users
All Apps
All Features
White-Labeled
Active Community
Mobile App
Live Support
100+ Tutorials
Unlimited Sub-Accounts
Unlimited Users
All Apps
All Features
White-Labeled
Active Community
Mobile App
Live Support
100+ Tutorials


