

.svg)

.svg)
.svg)
.svg)
.svg)
.svg)
Though Google Analytics (GA) can be a nightmare for a novice, if you perform website audits and implement effective technical SEO, it can be the most reliable and effective tool.
What is Google Analytics?
Google Analytics provides an in-depth assessment of a website or app's performance. Its ability to accurately analyze vast incoming traffic data makes it indispensable for marketers who mean business. Google Analytics (GA) integrates with Google's various marketing and advertising platforms, such as Google search console and Google ads.
There are several other tools with similar features. But since GA offers actionable in-depth reports and insights, it is most suitable for a data-driven marketing environment. This blog is an introductory guide to using GA. We discuss the essentials ā setting up your GA account, the various GA dimensions, metrics, GA audience, segments, and reports, and how to navigate through it all.
Is Google Analytics Free?
Google Analytics offers a free version with most of the features a small or medium-sized business might need. However, if you have a large enterprise, you should opt for the premium version ā Analytics 360. It has many advanced features such as attribution modeling, advanced funnel reporting, and roll-up reporting. But it has a high subscription fee. Analytics 360 starts at $150,000 annually.
How to Set Up Google Analytics?
Like other Google products, to set up GA, you need to create a Google account. You then need to register for Analytics. Usually, it has three layers.
- Organization: Bigger businesses run many accounts under an umbrella account known as an “organization.” For example, Microsoft can run many GA accounts, but the organization will remain the same, i.e., Microsoft. It’s optional to choose.
- Account(s): Various users can access GA using their accounts. You can assign up to 50 properties, i.e., websites or apps, to one account.
- Views: There can be two views per property — one with no configuration, the other with a filter to exclude any traffic from your own company, bots, and spam.
Here's how you can set up your Google Analytics account:
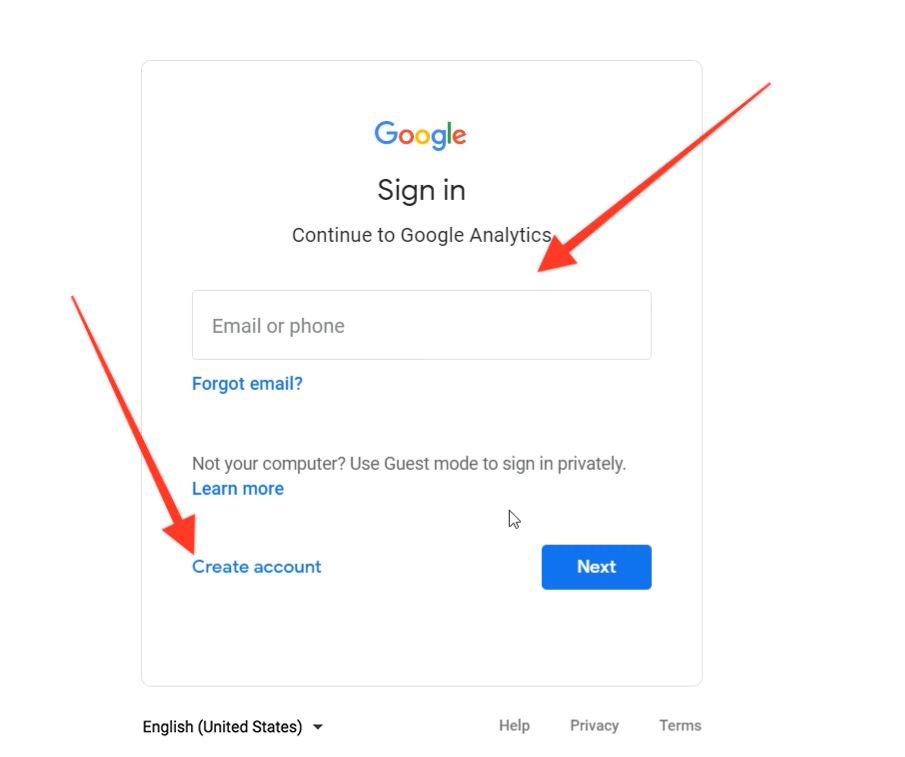
1. Create a Google account: Go to google.com/analytics and click on Sign in to Analytics
Begin with creating or signing into your current GA account.
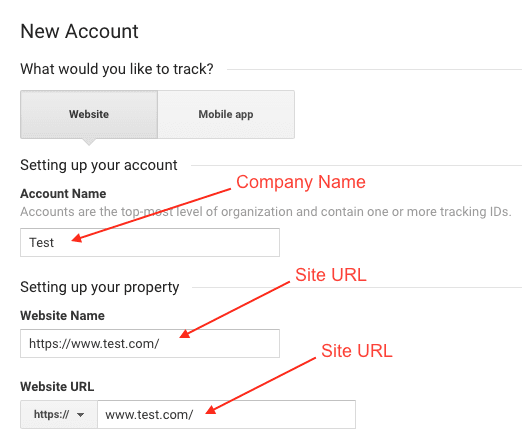
2. Add the website's name and enter additional relevant information in setting up your property field
Create and name your property and enter additional relevant information such as industry, timezone, etc. You can also choose an account to link this property to.
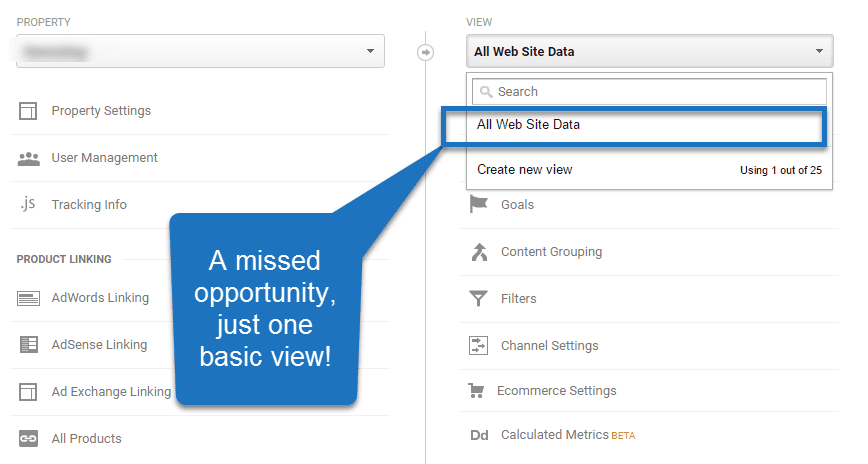
3. Add a view to the propertyĀ
Go to the property, create a view from the menu, name it, select the typeāweb or app, and fill in other necessary information. A property can have up to 25 views.
4. Add your tracking code to your website's <head> section
When creating a property, you need a unique ID and a global site tag to track and collect data. You can paste your global site tag on each webpage you want to "track." Place it right after the opening <head> tag. You'll also have to disclose what type of website it is, i.e., dynamic or static. It will help you to set up the data collection accordingly. For more information on how to install the Google Analytics tracking code, click here.
5. Verify if the analytics code is working on your website
Open the website to check real-time reports. It will show at least one visitor ā that's you; it means your code is working.
Do you need to add the Google Analytics tracking code to every page?
You don't need to add the code to every page of your website. If the website is big, all you need to do is insert the tag to every page template in the header module, and it will apply to all the pages. If you have two-page types, insert the code into two separate header modules, and it will apply to the rest of the pages.
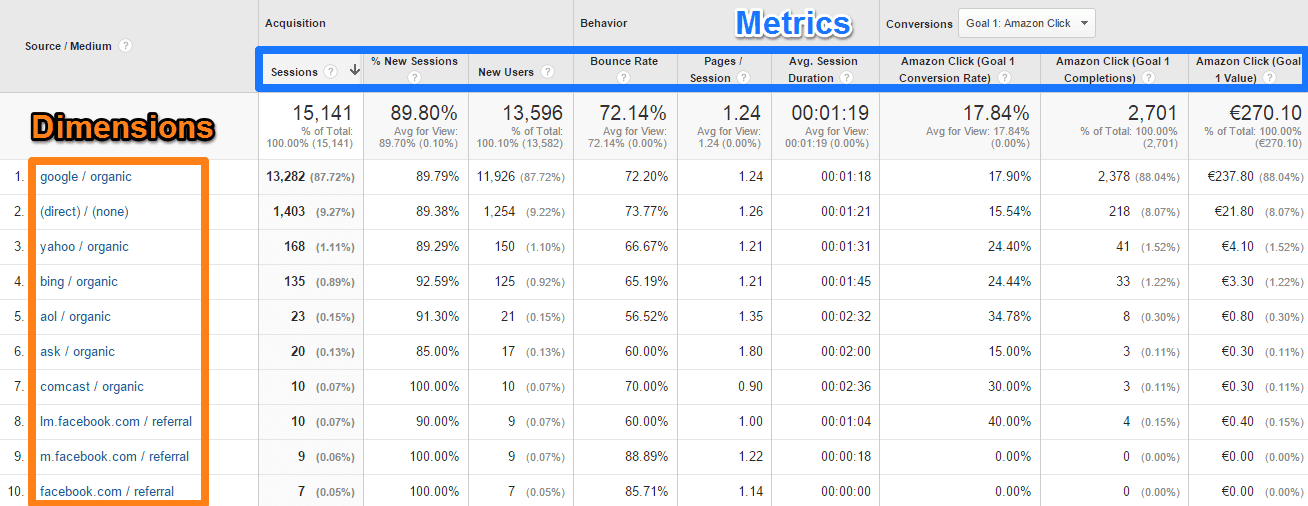
Google Analytics Dimensions and Metrics
To understand and use GA efficiently, you need to be familiar with its dimensions and metrics. Dimensions are standard variables such as browser, location, landing page, device, and customer type. Meanwhile, metrics are quantitative variables such as sessions, page views, conversions, bounce rate, and session duration. The GA reporting format has dimensions as rows and metrics as columns.
Custom Dimensions and Metrics
You can create custom dimensions and metrics using Analytics data and non-Analytics data. You can know more about user behavior and the relationship between engagement and metrics such as pages per session and conversions by creating the following three dimensions:
- Advocate: User who shared your content on social (stage 1 in the sales funnel)
- Subscriber: User who subscribed to your newsletter (stage 2 in the sales funnel)
- Customer: User who paid for premium access (stage 3 in the sales funnel)
What's a Google Analytics Audience?
An audience is a group of people with a common element such as region or age group. Google Analytics provides a few built-in audiences and insights on them based on available visitor data. GA also gives the option to create custom audiences. For example, if your target consumer group is female millennials living in Florida, you can easily make a custom audience that includes female visitors from Florida aged between 23 and 35.
Now you need to create a new audience segment. You can use its data for your reports.
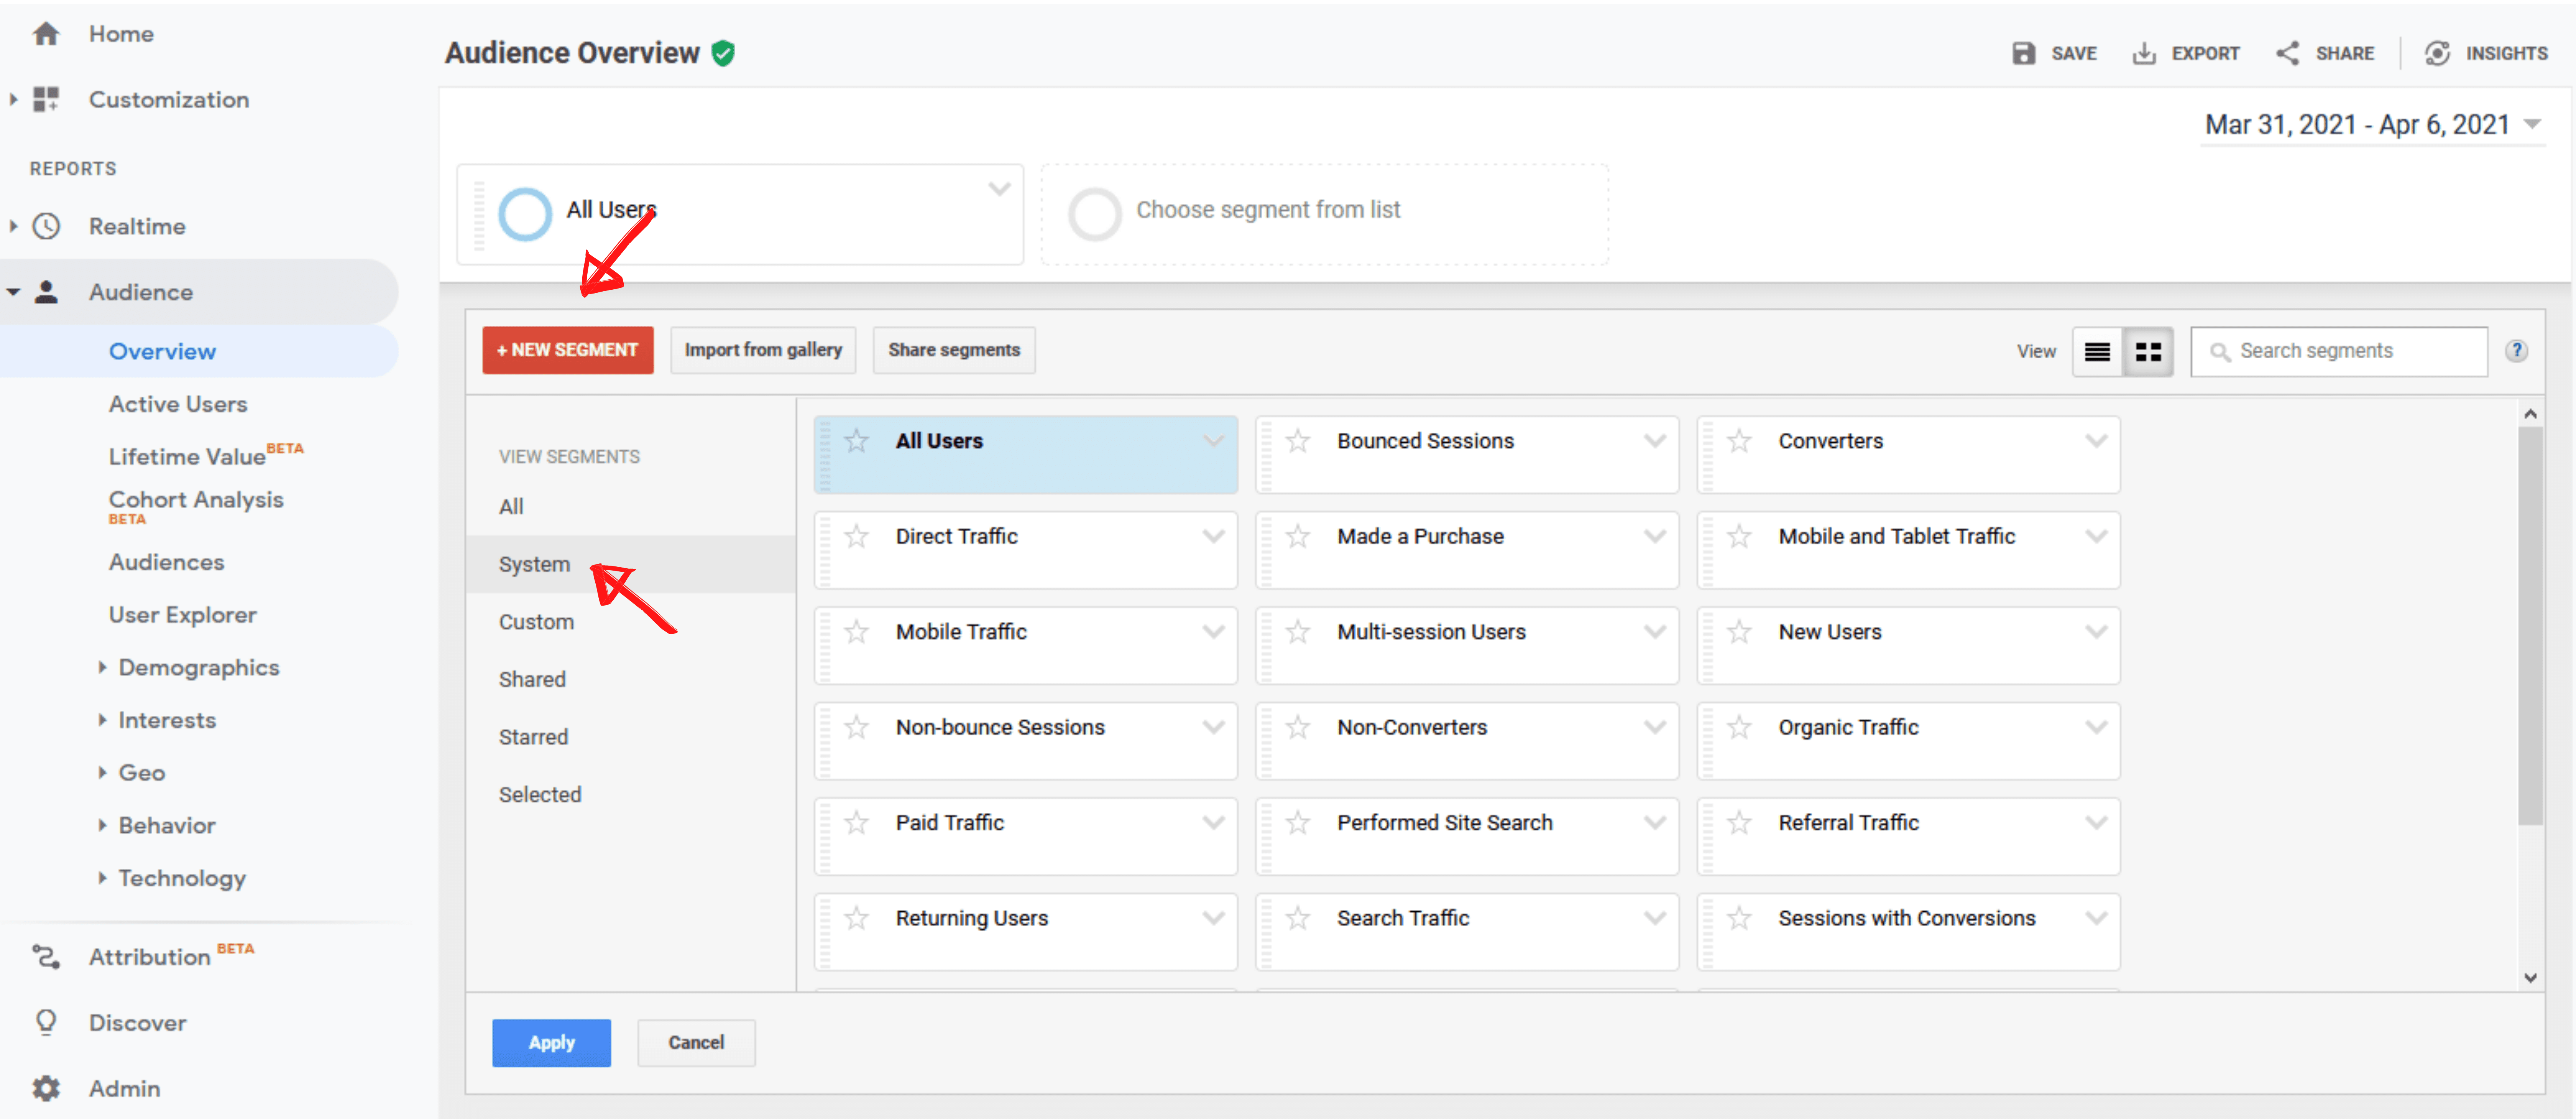
What's an Audience Segment in Google Analytics?
When your data is divided into small chunks, each set is called a segment. You can create segments based on different factors such as users, sessions, and hits.
- Users: Someone who has purchased from your site or has signed up for a program or service.
- Sessions: It includes categorization based on the task performed on a website—for example, all sessions when the user viewed a product page.
- Hits: This segment reveals all the website “hits” of a specific event. For example, you can determine all the “hits” of an instant purchase or an addition to the shopping cart.
Like “audiences,” Google Analytics also allows you to fetch data using various “segments,” which can sometimes be highly granular. It means that you can further split the data according to even more specific variables. A report can use a maximum of four segments at a time.
What are the Different Types of Reports in Google Analytics?
Reporting can be a bit overwhelming in Google Analytics as there are numerous options to choose from. Here are the eight major and very important types of reports and their variations that Google Analytics can generate for you:
1. Google Analytics Real-Time Report
It gives you real-time insights into the website's traffic data. It helps you determine the number of visitors and the particular pages they're visiting. This report also tells you the origin of the traffic as well as location data.
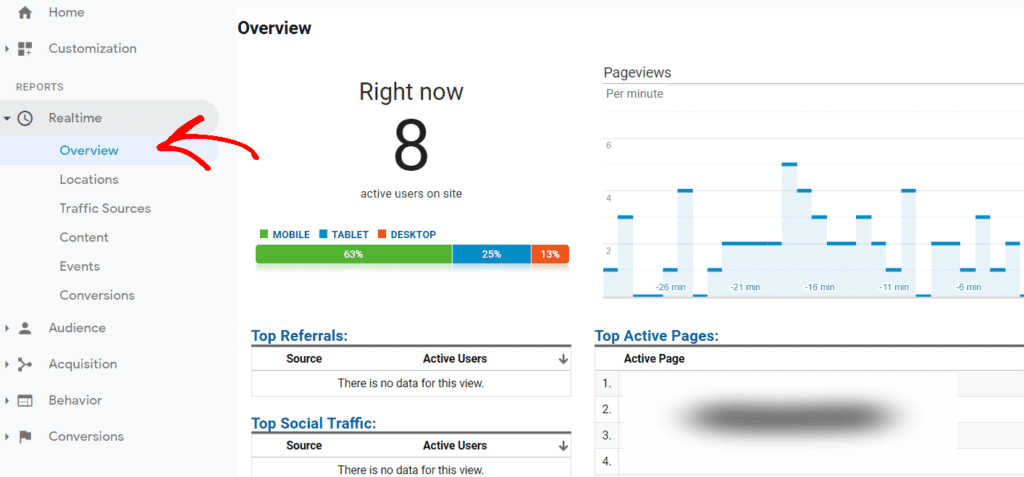
However, real-time reports offer little value for strategy-building. But you can use them to track how much traffic you're getting from a new social media or blog post and gauge the success of a sales event.
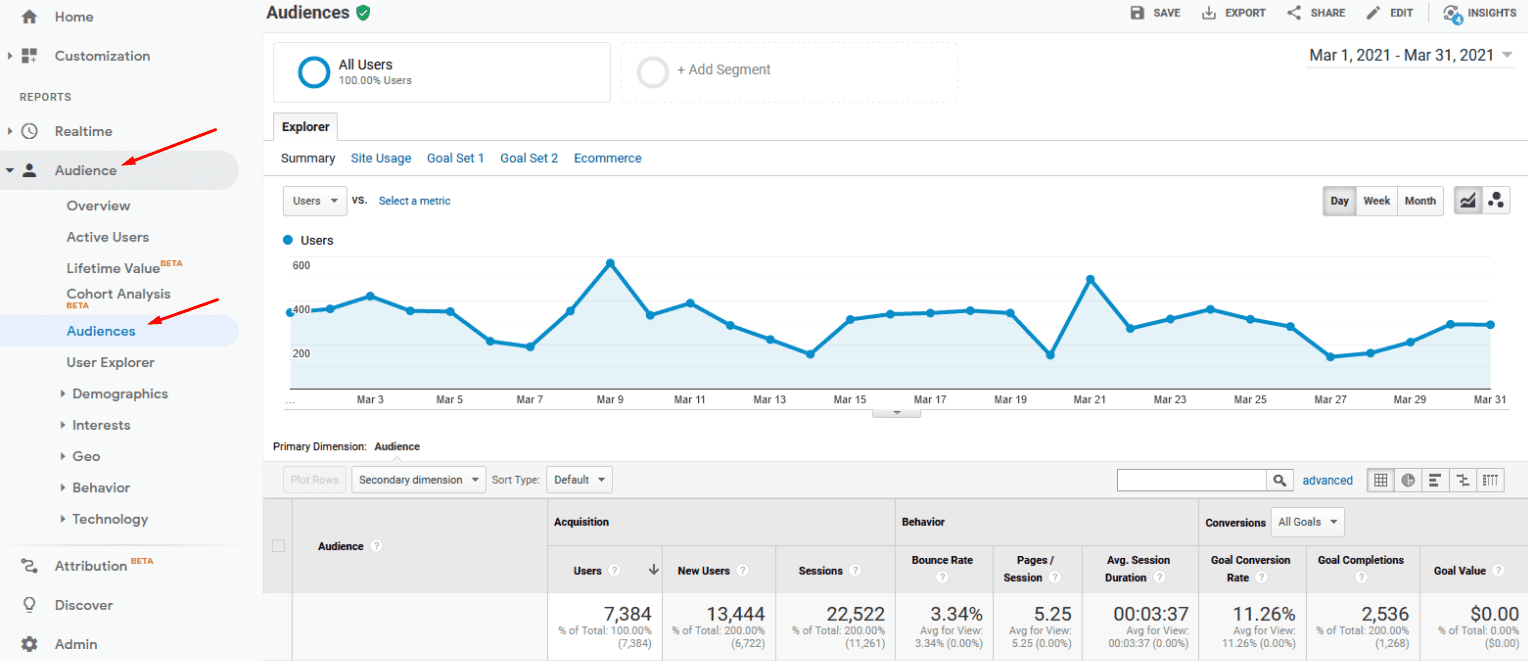
2. Google Analytics Audience Report
It carries much more weight than a real-time report. It's essential to review it a few times every week to assess your website's performance accurately.
You’ll be able to find “Audiences” below “Overview.” There are also expandable menus for various metrics such as “Behavior,” “Interests,” and “Demographics.” The best way to learn is to explore each of them and see how they can help you assess the traffic.
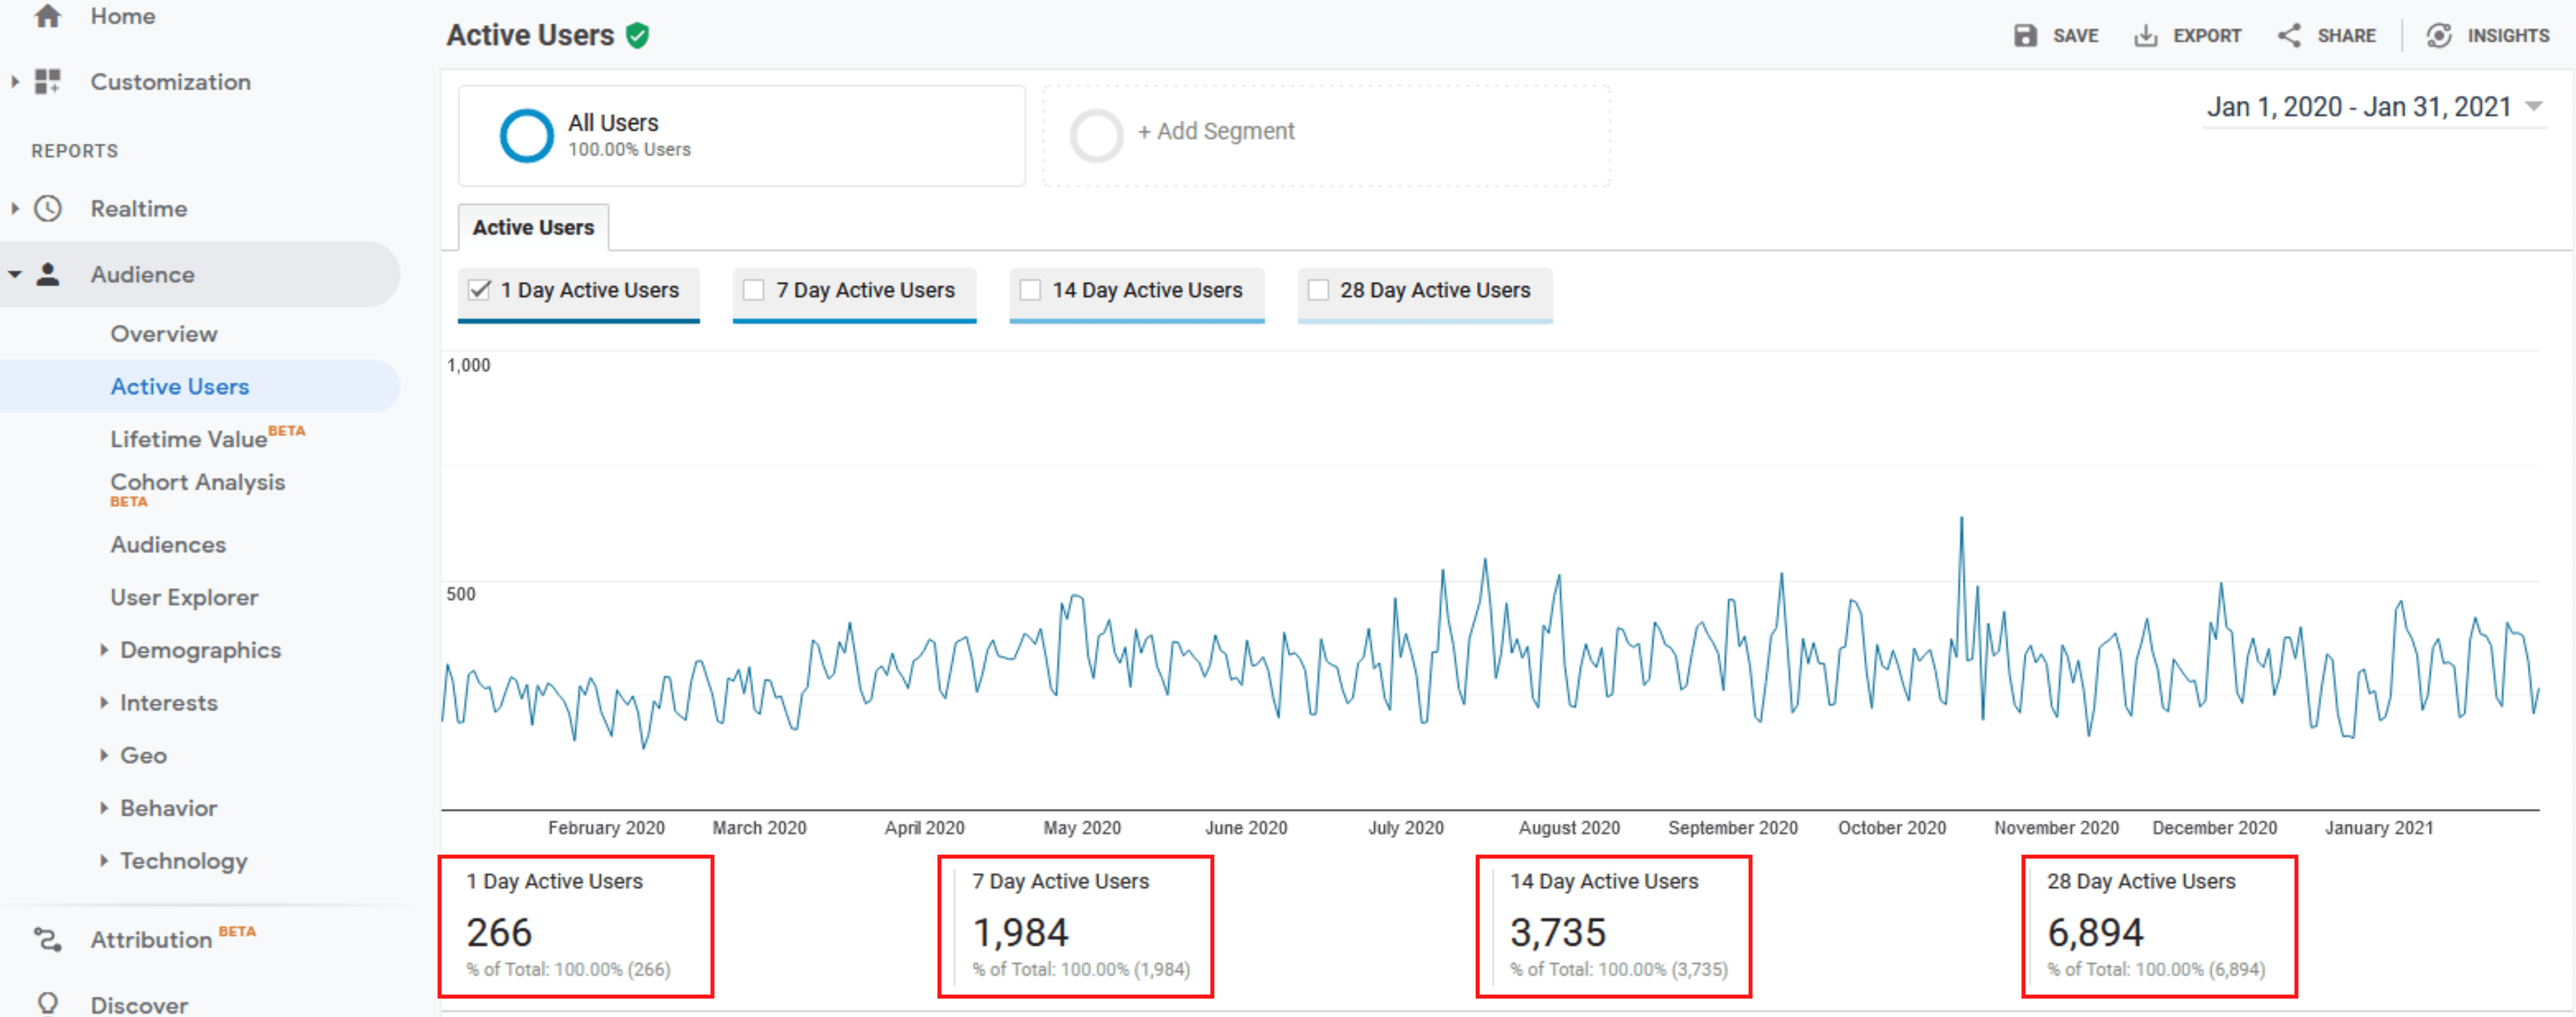
3. Google Analytics Active Users Report
“Active users” aren’t the users who are currently on your website. It refers to users who visited your website the previous day and remained active for some time.
You can use this report to analyze data in various ways to make informed business decisions. For example, if your traffic includes more one-day users than repeat visitors, you might be struggling with retention. When visitors don't come back to your site or app ā this report can help you find out why.
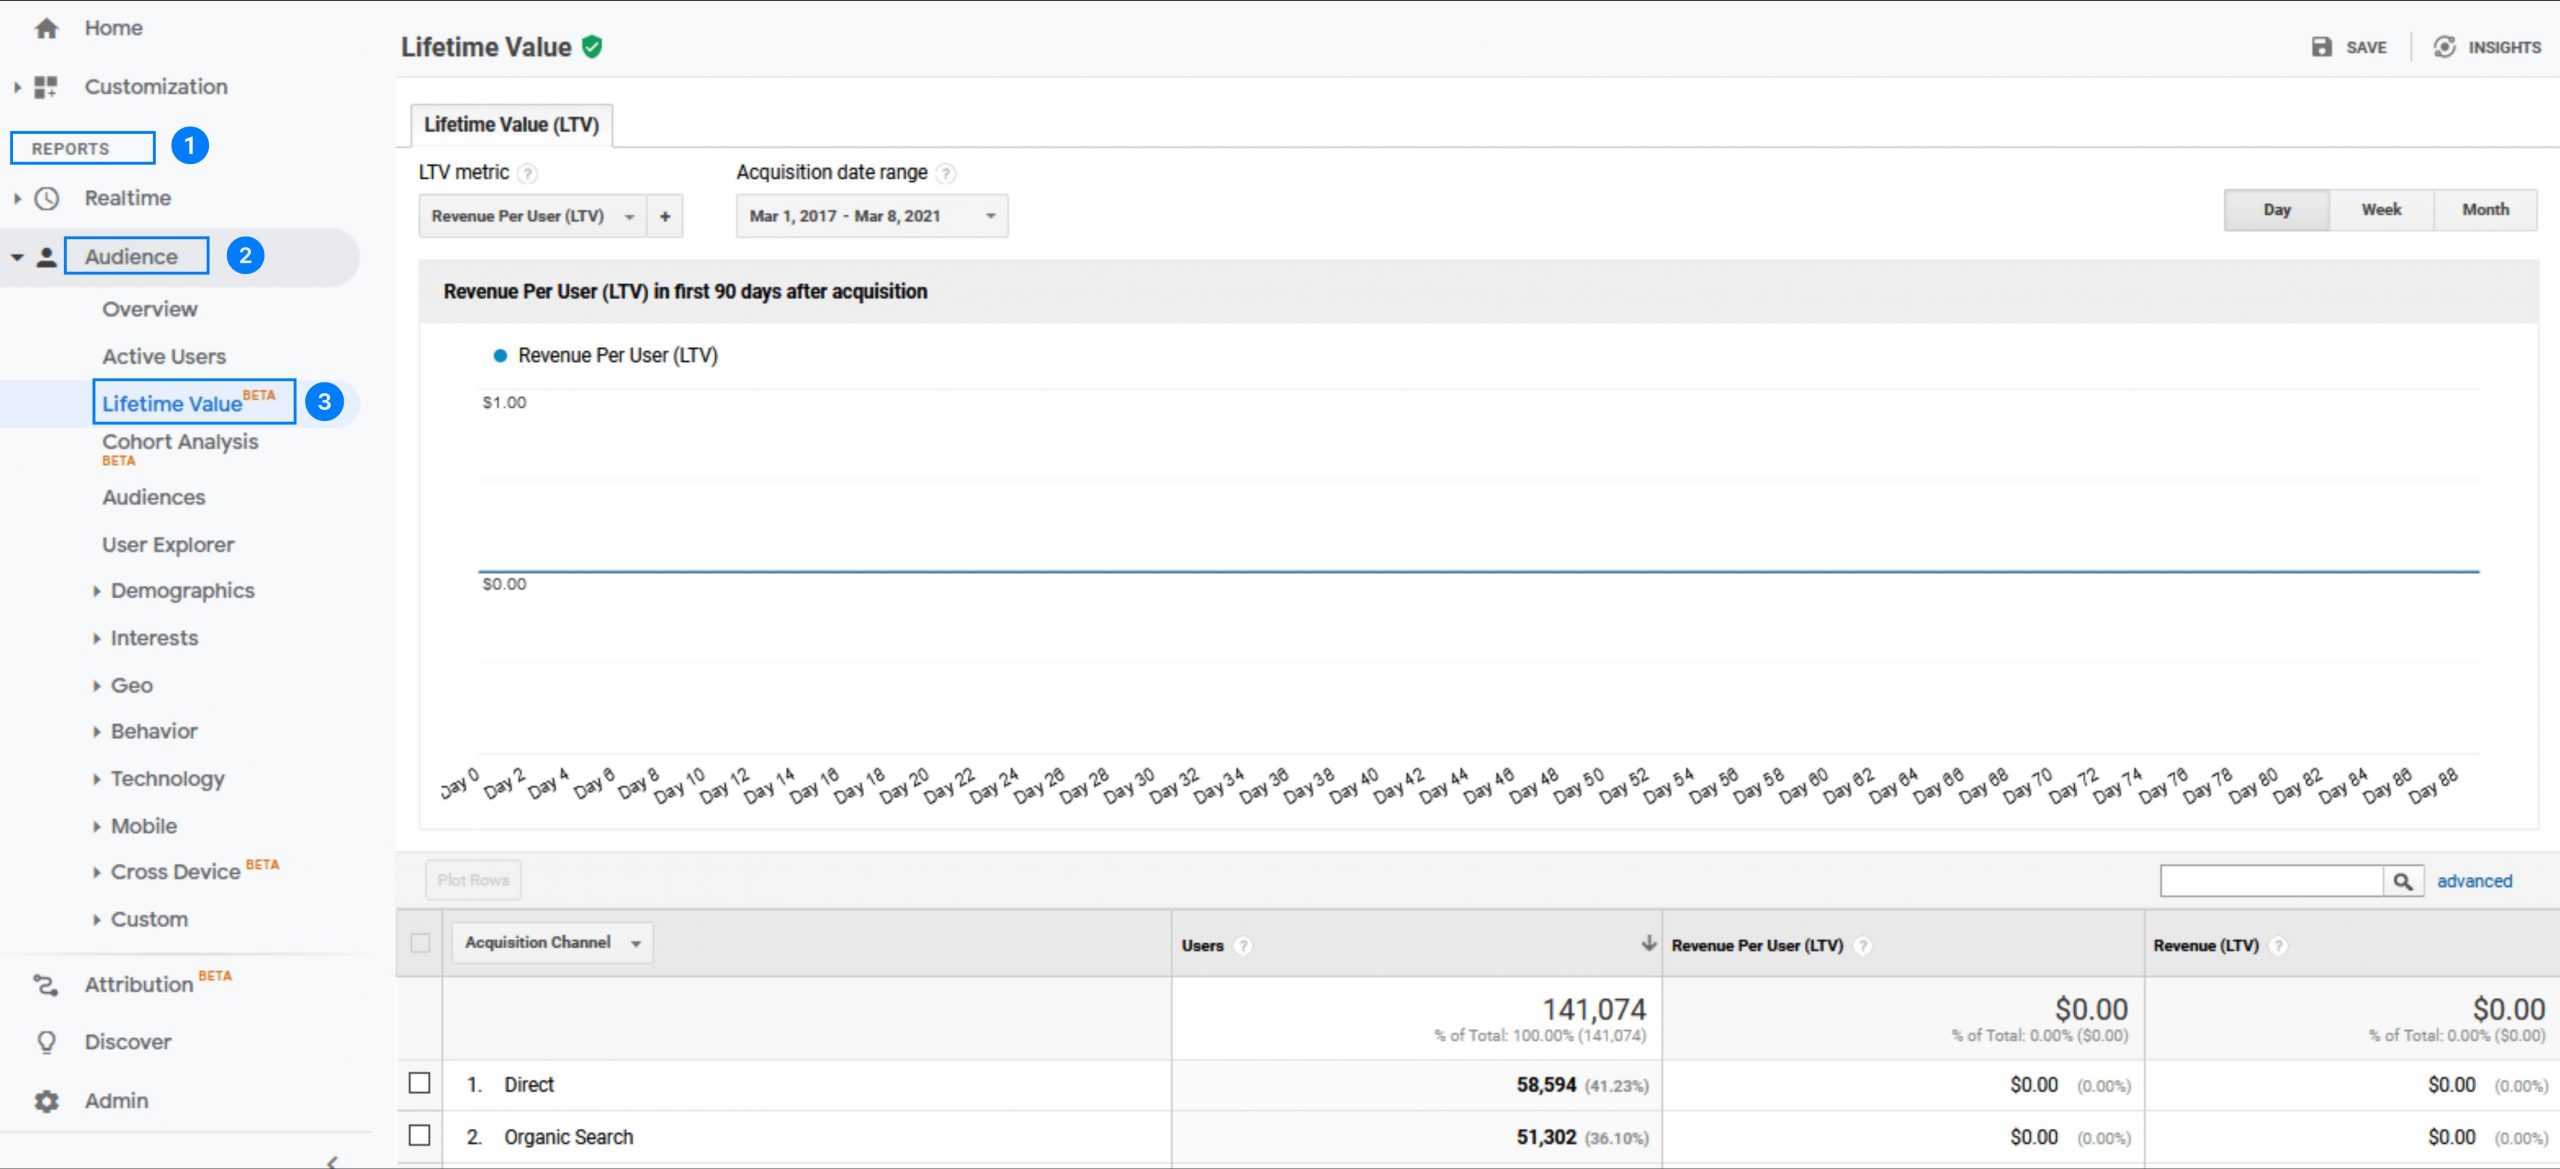
4. Customer Lifetime Value Report
As a marketer, you are probably familiar with the concept of Customer Lifetime Value (CLV) and how it's calculated.
The CLV report tells you how much value each customer is bringing to your business. You can also evaluate the lifetime value of customers acquired from paid advertising compared to those attracted through organic search. You can use this information to decide which revenue channels deserve more attention. It's important to note that the lifetime value is measured only for 90 days.
5. Google Analytics Cohort Report
Cohort analysis is popularly seen as “the single most powerful report in GA.” It groups customers by a common characteristic, such as acquisition date — the day someone first visited your website.
You can find the cohort type, which by default is the acquisition date in GA, in the left-hand column. It is further split by cohort size into the day, week, or month.
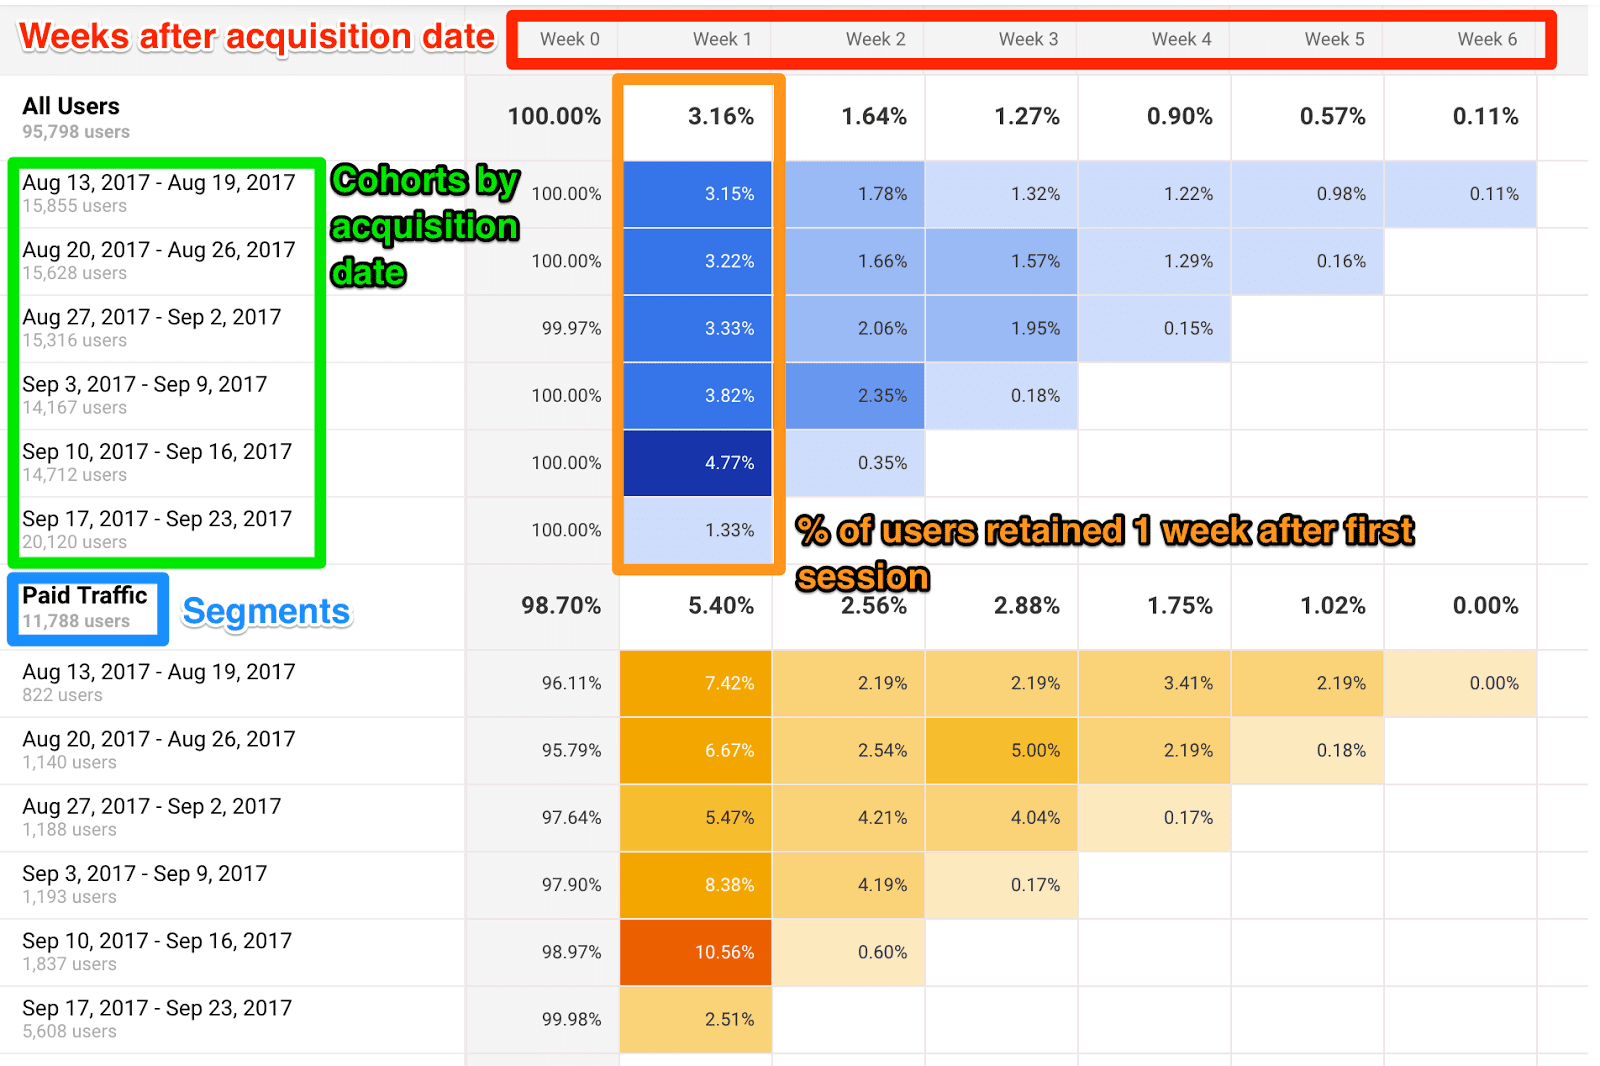
The first row contains information about all the customers in that cohort. The rows below show the activity on that day, week, or month. The cohort report will tell you how many campaign goals have been achieved during a specific date range. It also includes additional details such as the customer acquisition date and goal completion date.
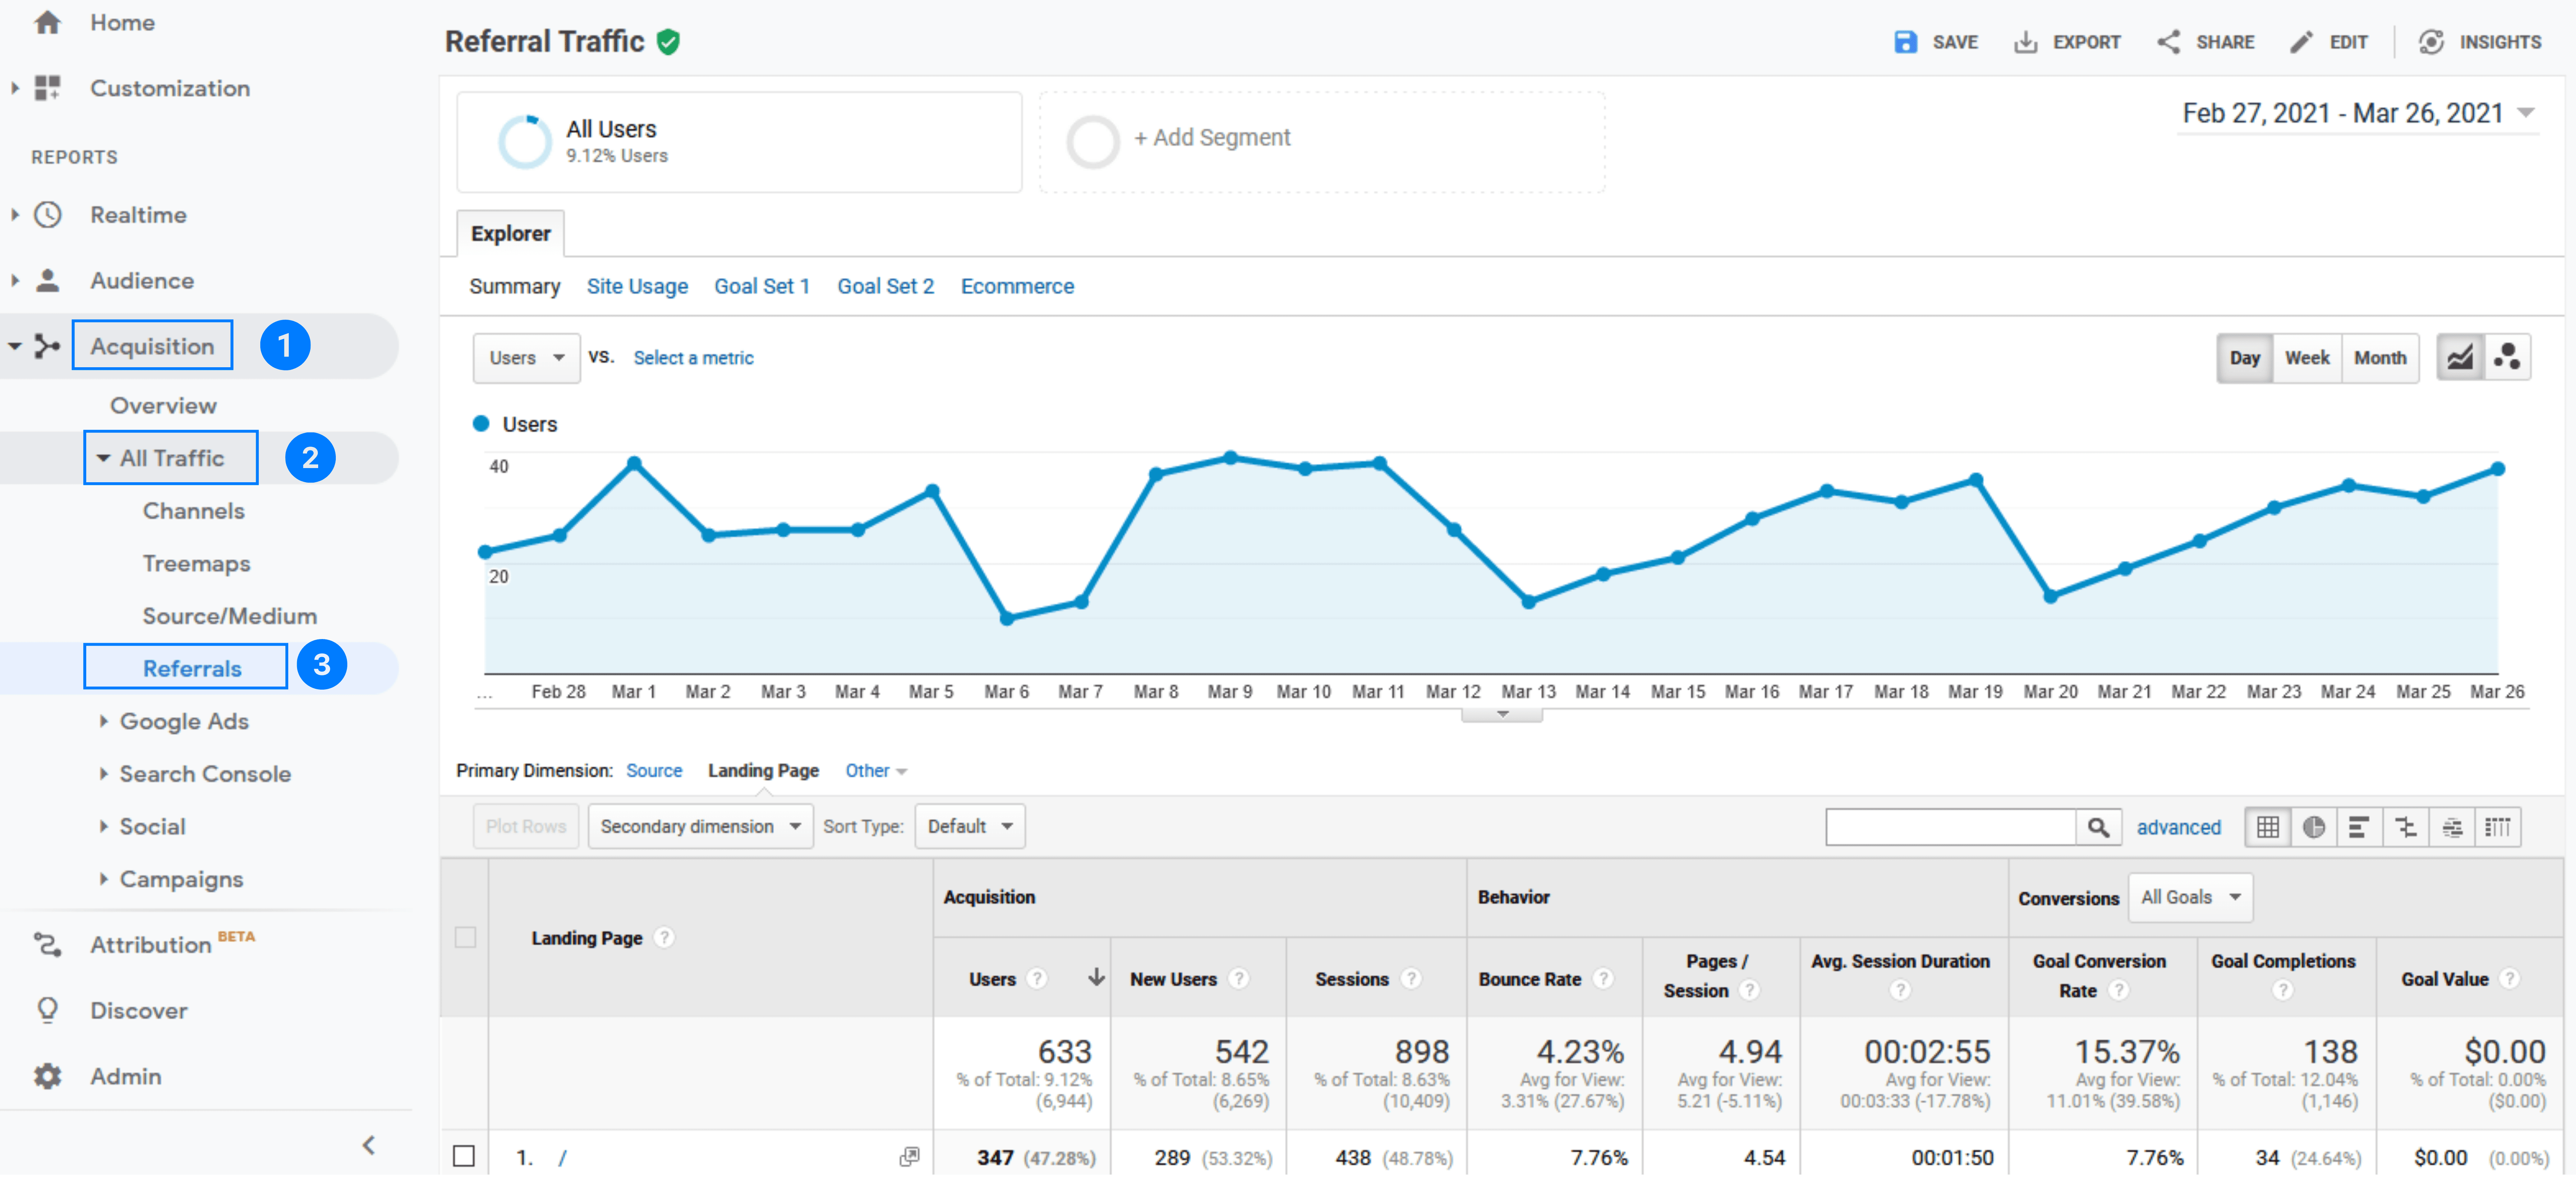
6. Google Analytics Acquisition Report
It provides traffic analysis by source. It can be direct, organic, referral, social, email, and paid search.
Go to “All Traffic” on the left column, click on “Channels,” and select a category to see the projections associated with that source.
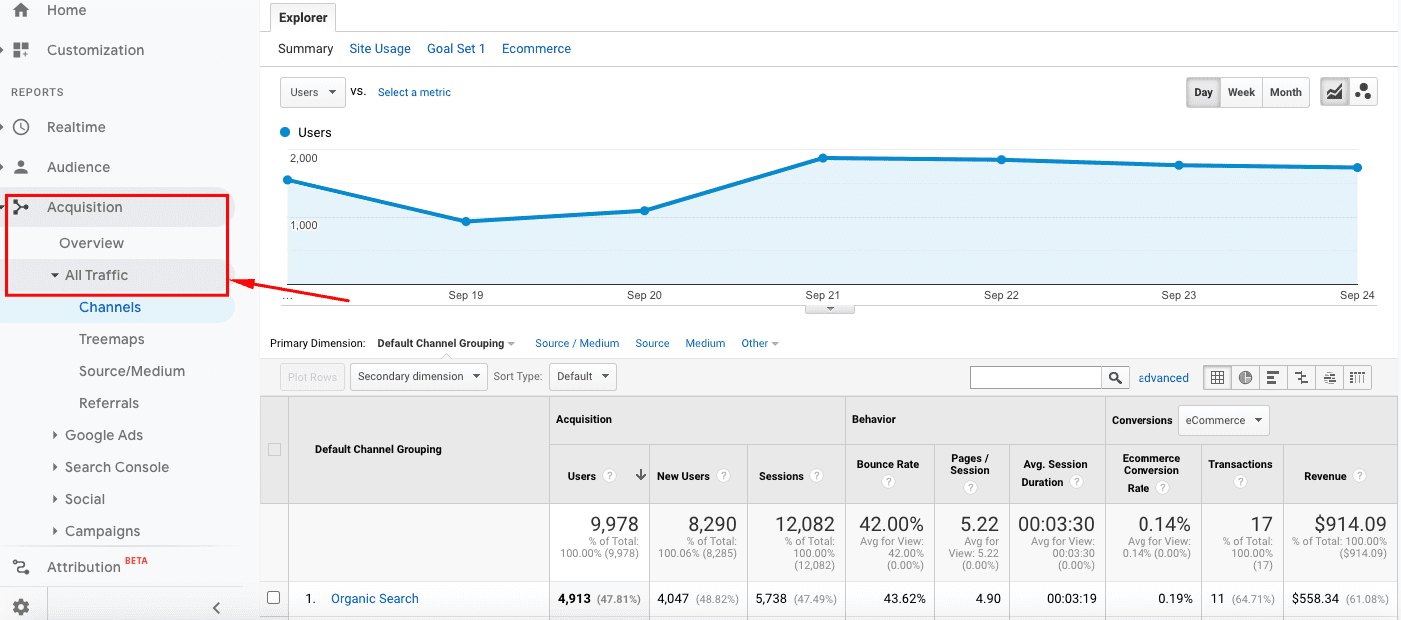
If you want to see the report in graphics format, click on “Treemaps” under “All Traffic.”
GA also informs you which channel is sending you more referral traffic, so you can tweak your strategy and focus your marketing efforts accordingly. Apart from the traffic source, GA also tells you which landing pages on your website are receiving referral traffic.
7. Google Analytics Behavior Report
The behavior reports given by Google Analytics are immensely useful for marketers. They reveal what actions your visitors take when visiting your website, including the pages they visit. You can obtain these reports from the menu on your Google Analytics dashboard's left sidebar, where you will find various sections and tools.
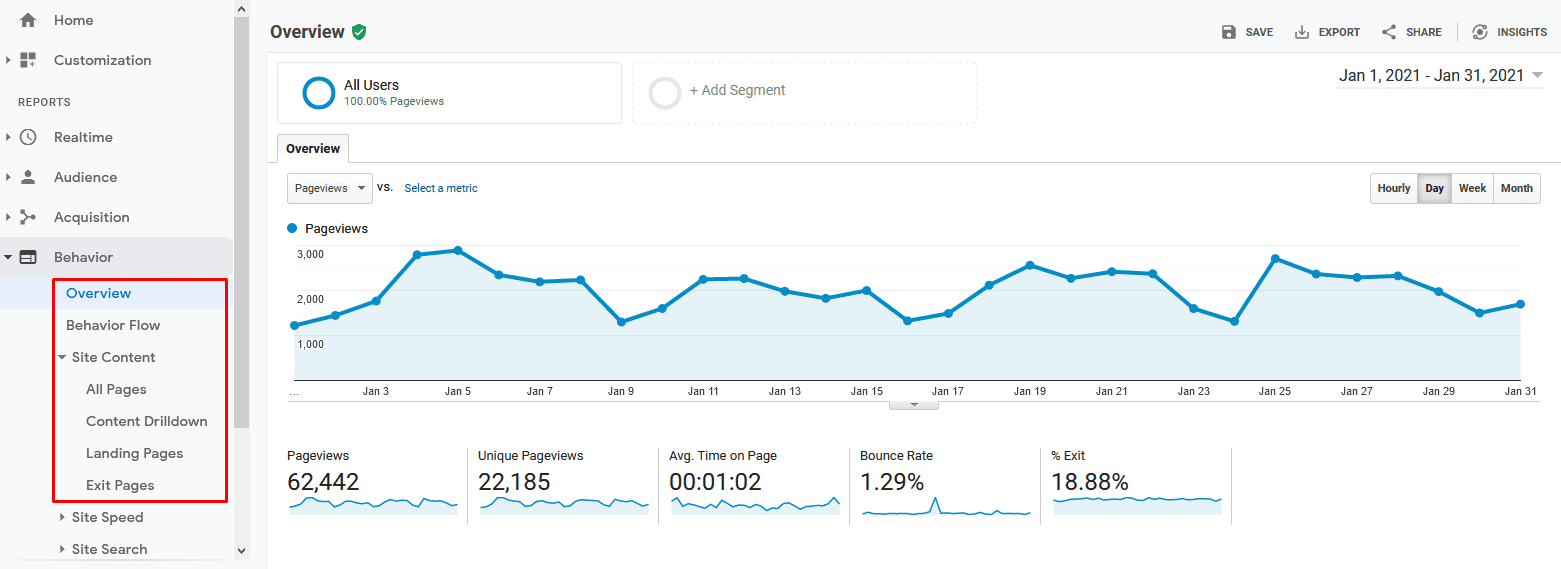
Site Content
This report helps you audit and update your website content based on the performance of web pages, blog posts, and landing pages.
All Pages
It gives you a page-wise report on the traffic and insights about traffic fluctuations, if any, over a specific period. You can get it by going to Site Content > All Pages. It will also allow you to compare page views between different URLs. If you add a Page Title, you will see each page's name alongside its URL.
Content Drilldown
This report shows your site's structure at the subdomain and subfolder levels. If you have a highly complex website, this report can be tremendously helpful.
Landing Pages
Landing pages report tells you how a visitor first interacted with your website. It informs you of the sources (direct, organic, paid, social) that got visitors to the landing pages. You can add "source" as a secondary dimension. It displays the web pages as seen on smartphones and tablets to help you manage the traffic from portable devices.
Exit Pages Report
It shows the last page a visitor saw before leaving your site.
In addition to these reports, there are several others too:
- Site speed report: It gives information about how quickly your site loads. It also includes a site speed page timings report, which provides a URL’s average page-loading time.
- Site search report: It provides critical information about every website view, including usage, sessions, and search terms used. You can use it for keyword research.
- Events report: It provides information about user interactions with content. To get this report, you need to add a code to your website that tracks the actions you’re interested in.
8. Google Analytics Conversion Reports
Every website has one or more objectives for the visitors. For example, an eCommerce site owner may want its visitors to sign up for its newsletter, create a user account, and/or complete the purchase.
Media companies want visitors to spend as much time on their site as possible to maximize ad revenue. Similarly, B2B websites wish visitors to download educational material such as eBooks or reports or sign up for a webinar. With GA, you can measure all these objectives and do much more.
These goals are called conversions. There are four major types of goal-oriented metrics:
- Destination: You can use it when the goal is to reach a specific page, such as a product page or a thank you page.
- Event: It’s when the goal is to watch a video or share a piece of content on social media.
- Duration: This one is when the goal is to stretch a user’s session beyond a preset period.
- Pages per session: You can use it when the goal is to make a user visit specific pages per session.
Once you've decided on the goals, follow these tips to create, edit and share them:
Overview
If you want to assess your overall goal-wise performance, go to “Overview” and get a report. To drive maximum value from it, you should compare date ranges and/or look at segment-wise goal completions.
Goal URLs Report
You must know where a goal was achieved. For example, if there are newsletter subscription opt-ins on three different pages, the goal URLs report will tell you the visitor signed up for the subscription on which page.
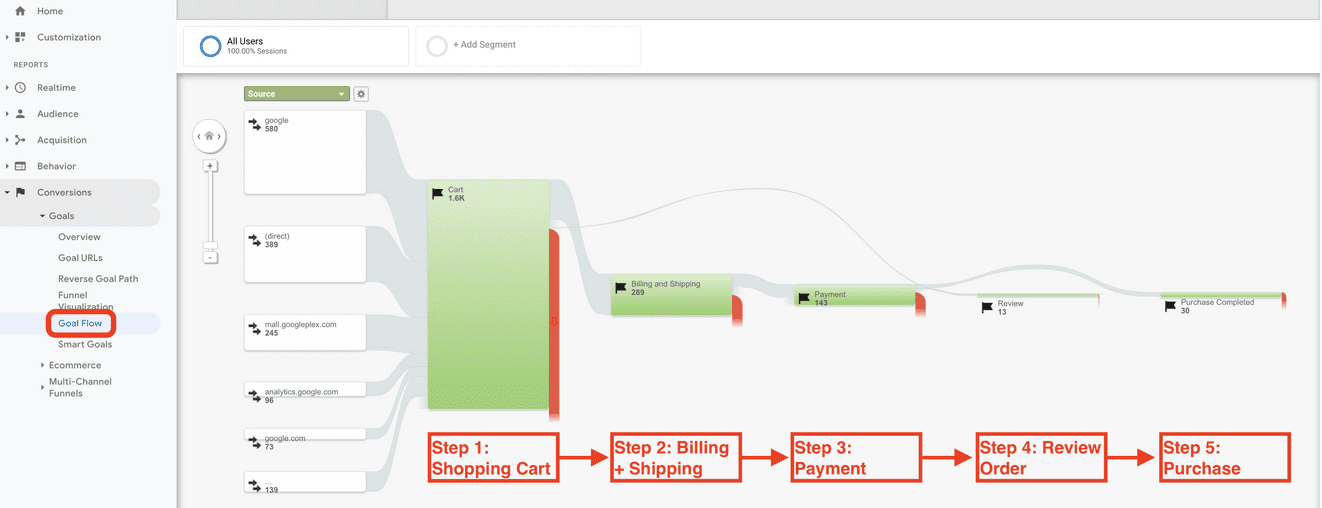
Funnel Visualization Report
It allows you to see sequential goals to help you visualize your sales funnel.

In a sales funnel, a customer journey has various stages and corresponding goals.
The first goal: Visitor visited the product listing page
The “goal before checkout”: Visitor added a product to the shopping cart
The “previous goal” just before the purchase: Visitor clicked “checkout”
The last goal (can be): Visitor arrived at the order confirmation page
Try to determine why visitors are leaving at various stages to increase the conversion rate. For instance, if most users leave the session during checkout, you can alter the process to let them check out as a guest without creating an account. You can also take other measures to lower the shopping cart abandonment rate.
Goal Flow
It provides you with the sessions that led to the final goal. However, in Goal Flow, it doesn't matter if the user completed a particular goal. It shares loopbacks and includes sessions when a user moves back to a previous page or refreshes the current page. It helps evaluate various segments to compare conversion rates.
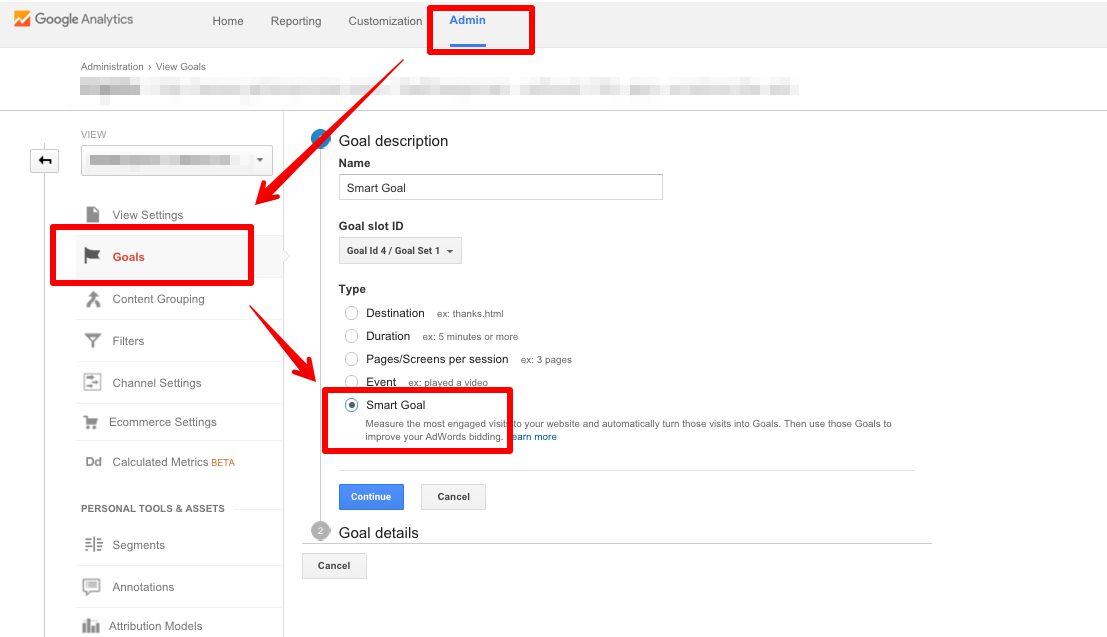
Smart Goals
This report is for marketers who use Google Ads but don't measure conversions. AI and machine learning help identify the "best" sessions or those with the highest probability of generating conversions. Google then uses them to make Smart Goals. You can use Smart Goals in Google Ads to optimize your advertising performance.
Conclusion
Google Analytics is a valuable and multi-feature tool that any business can use to get actionable data. If used smartly, it can substantially boost your website's performance.Ā There is a lot of information in this article, and you can always come back to learn sophisticated techniques for deeper insights. We wish you good luck on your journey with Google's complex and potent analytical weapon ā Google Analytics.

.svg)


.svg)
.svg)
.svg)
.svg)
.svg)