

.svg)

.svg)
.svg)
.svg)
.svg)
.svg)
Optimizing your website for success has never been easier thanks to the power of the internet's number one analytics tool - Google Analytics. It is estimated that as much as 53% of all websites use the platform to reach their business goals.
While most users may be able to navigate Google Analytics at the elementary level, there are countless tools available for tracking goals, analyzing user behavior, and increasing your level of user engagement.
If you've had an opportunity to poke around the platform and are ready to take your experience to the next level, then continue and learn how to navigate Google analytics like a pro and start gaining an edge over your competition.
What is Google Analytics?
Google Analytics is an analytics tool developed by Google to help users monitor and analyze their website traffic. It provides invaluable insights including the number of unique visitors, geographic locations, demographic information, time spent on individual pages, and traffic sources.
While other alternatives exist including Chartbeat and Semrush, Google Analytics is unquestionably the industry leader thanks to its accuracy and ease of use. Creating an account is also absolutely free.
However, a premium version of the tool does exist called Google Analytics 360. This subscription will cost businesses $150,000 a year for the additional reporting features and tools. Thankfully, unless you're managing a large-scale enterprise or corporation, the free version provides everything a website owner needs to have mastery over their domain.
Why Should I Use Analytics for My Website?
Attempting to create and operate a successful website for your business is like attempting to travel to a foreign location without a map. Though it's technically possible for your journey to be a success, you will undoubtedly waste valuable time, money, and resources without a reliable guide pointing you in the right direction.
Google Analytics allows you to tag any material you create for marketing so that you can gather actionable information about your audience in real-time. If your analytics reporting determines that certain website pages have a high bounce rate, it's a sign that the content or layout of your page is low-quality and unengaging.
Demographic insights can tell you the age, gender, and average income level of those who most frequently visit your website. You can then utilize this information to create and optimizing future website content and marketing campaigns to capitalize on those visitors and create conversions.
Not only will Google Analytics automatically track all of this data and more automatically, but it also offers the ability to create countless custom goals and reporting so that you can tailor solutions that fit your business's unique needs.
How to Navigate Google Analytics Like a Pro?
Now that you understand the importance of having a website analytics tool on your side, it's time to take a look at how you can start improving your website reporting today.
1. Start Crawling and Indexing Your Site with Google Search Console
For those that are new to managing a website, the concept of web crawlers might be brand-new. Google Search Console is a tool that's separate from Google Analytics but is necessary if you want to gain reliable data from the latter.
Crawling is what a web crawler, also called a spider, performs to grab and index all of the information from all websites across the web. Search engines like Google use their crawler to index information along with its search algorithm. This is how the search engine can rank websites and provide you with the best search results possible.
You can manually submit the latest version of your website to Google Search Console so that it crawls and downloads the most recent information. This same tool will also help you in remedying existing issues with your sites such as URL structure, duplicate content, page speed, and mobile performance.
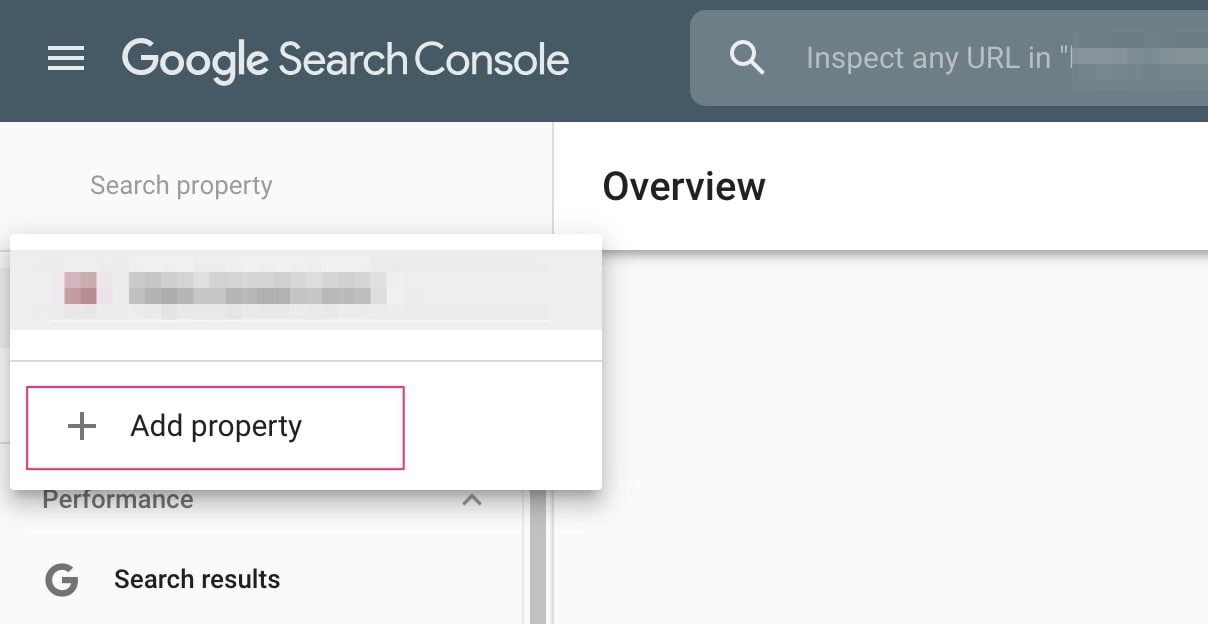
You can access Google Search Console here by logging into your existing Google account. From there, you will need to select the domain you wish to crawl and index. If you have yet to submit your domain to Google, you will need to verify ownership of the site before proceeding. You can add a new domain by clicking on + Add Property when searching for a property.
After completing that step, you can begin the process by clicking on Fetch as Google underneath a section titled Crawl. Make sure to do this for all versions of the site. After the Google Search Console finishes fetching data, be sure to index it.
If Google Search Console detects any issues with your site health, you will need to take steps to remedy each one. Failure to optimize your site in this regard will almost certainly cause any actions taken as a result of Google Analytics to be in vain.
You can also submit a sitemap to Google Search Console to potentially improve its ability to properly read and index your entire site. You can learn more about that topic here.

2. Implement Google Tag Manager to Track Your Marketing
Google Tag Manager is an essential feature within Google Analytics that allows you to easily track events on a given website page. This will provide you with a short code snippet that you can paste into the header and body of the page without needing to edit or modify any lines of code. Many modern website editors provide a field for you to paste this without ever needing to access the HTML.
The power of Google Tag Manager is the ability to sort captured data automatically so that it only reports the information you want to see. You can access GTM here.
While it can be easy to get overwhelmed with all of the tools and dashboards associated with Google Analytics, allowing them to work together harmoniously will give you the best results. In the Tag Manager, simply select the same domain you are managing through Google Analytics. Then, you can click the box that says New Tag to start tracking new events.
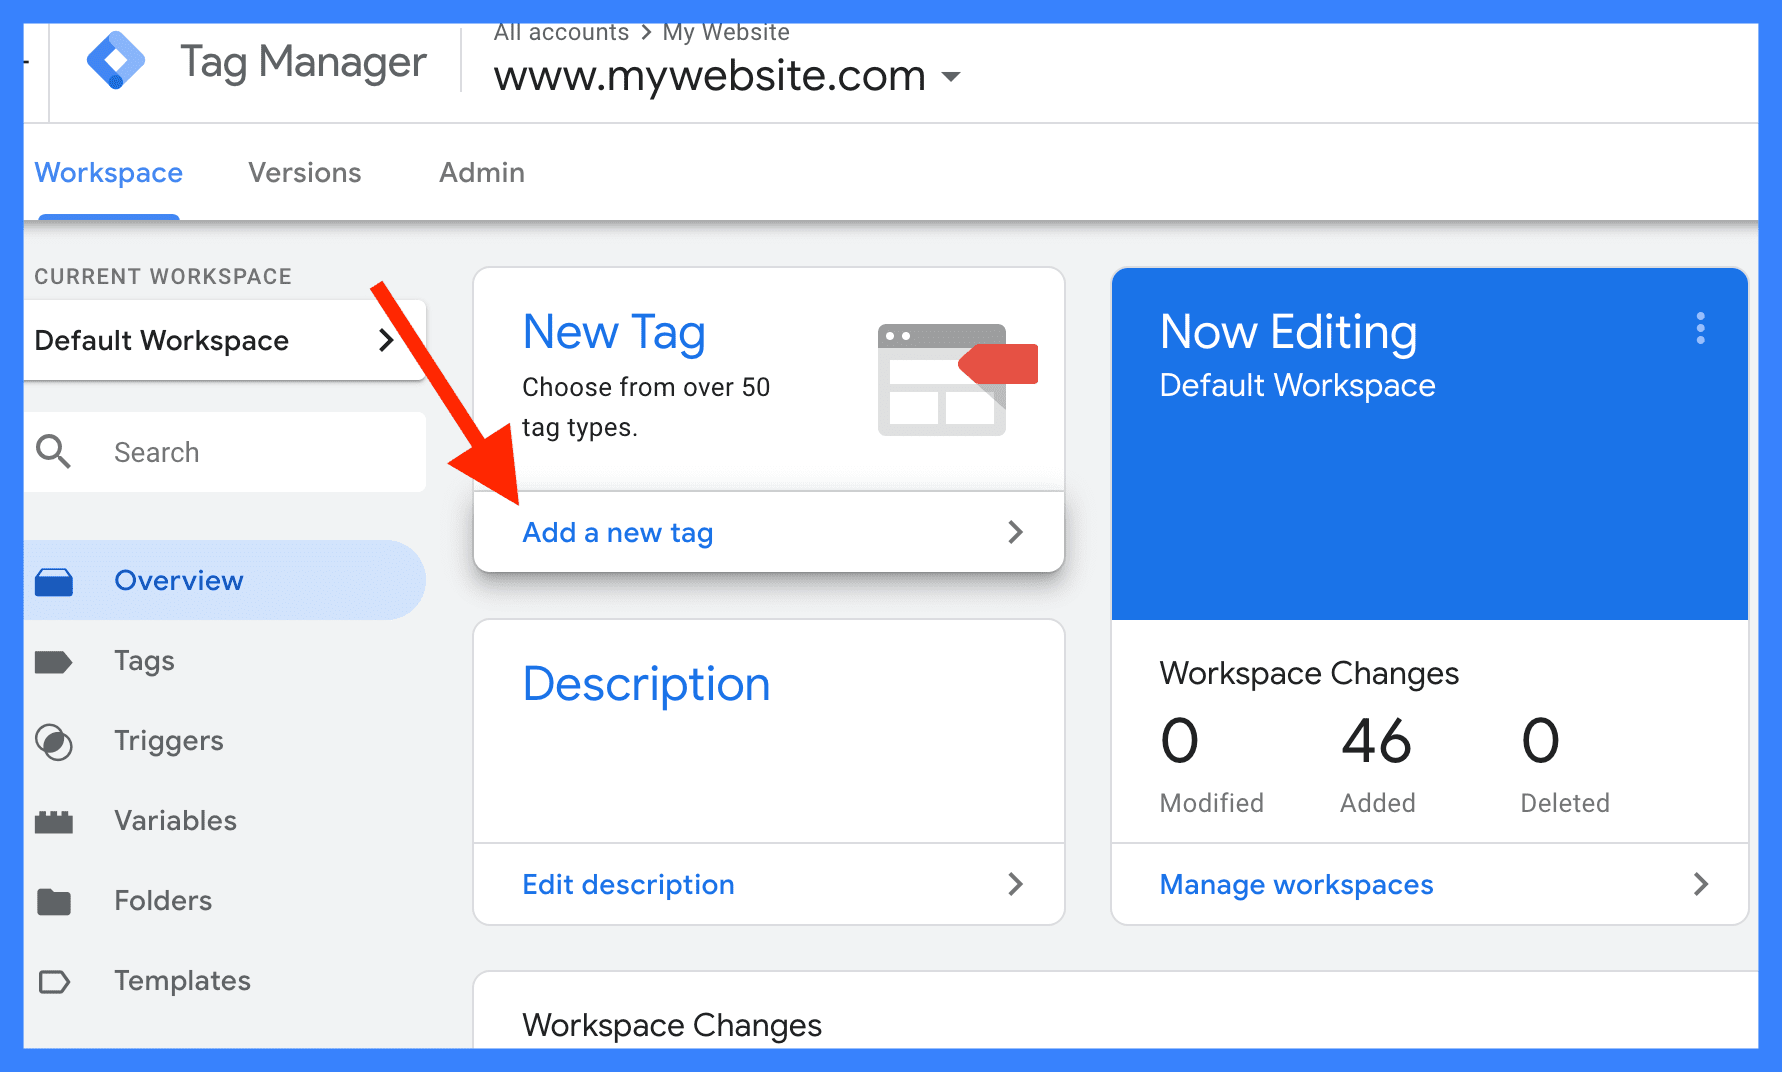
You can also find your existing tags by selecting Tags within the column on the left-hand side. Examples of events that you can track include conversions, completing a form, downloading a file, link clicks, video plays, scroll tracking, and much more. By aligning your business goals with the right events, you'll be able to know exactly how your site is performing and make adjustments as necessary.
Learning Google Tag Manager will not just be beneficial for your core website, but can benefit any additional campaigns you run when creating new landing pages or sales funnels.
3. Get Comfortable with All Types of Google Analytics Reporting
Google Analytics offers a treasure trove of reporting options so that you can keep your eyes on what’s happening with your site both in real-time and in the long term. Those primary types of reports include:
- Real-Time
- Audience
- Acquisition
- Behavior
- Conversions
4. Real-Time Reporting in Google Analytics
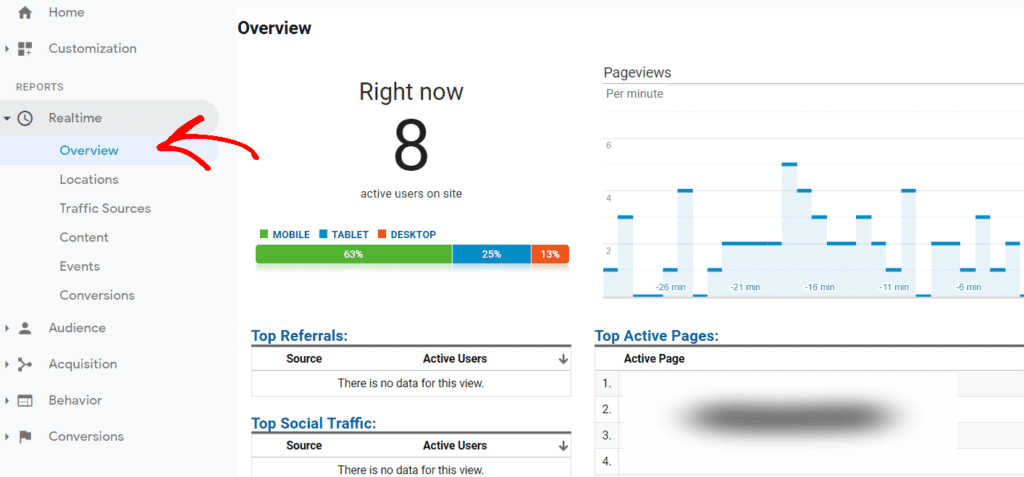
Real-time reporting will provide insights regarding your web traffic each moment that it happens. This type of data allows you to utilize actionable data and make changes to your website and campaigns immediately. Real-time reporting allows you to review visitor locations, the origins of the web traffic, custom event goals, goal conversions, and what pages users are spending time visiting.
For all of these, you can view what active visitors are doing on your site at the moment or within the last half hour. Not only are the insights invaluable, but real-time reporting offers the added benefit of allowing you to catch errors in your campaign early. Whether there's an issue with your Google Tag Manager, your content, or a page loading correctly, you can solve the problem before it has a lasting impact on your marketing results.
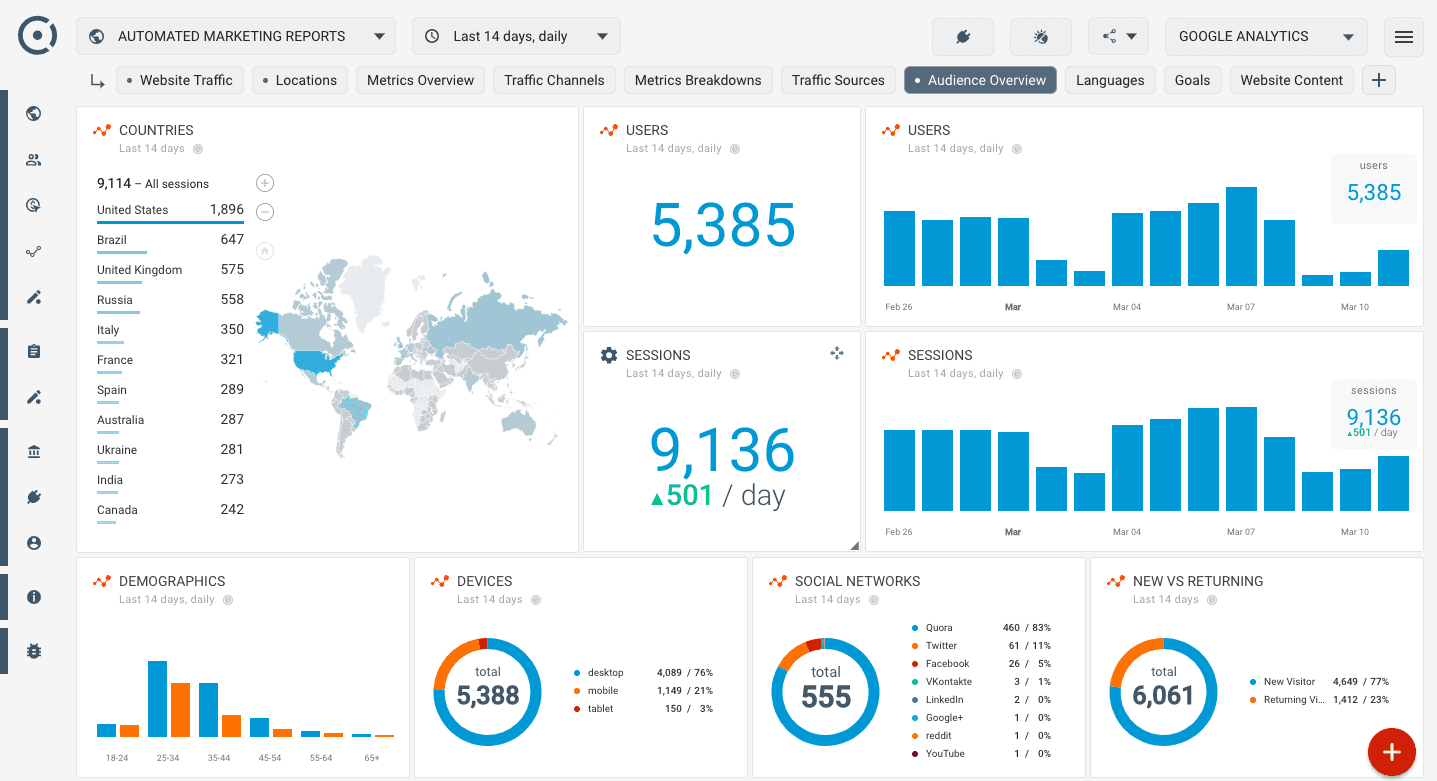
- Audience Reporting
Audience reporting refers to any data that Google Analytics can determine about the types of users visiting your website. When multiple users happen to share similar attributes, you can consider that segmented group one type of audience. By observing the actions and behavior patterns of different types of audiences, you can determine which types of audiences are more worthwhile to pursue.
The Audience tab allows you to gain reporting based upon age, gender, interests, geographic location, behavior, technology, and device types. You'll be able to filter unique visitors from returning ones, determine which types of devices are being used to visit your site, and even compare your website's data with competitors in your industry.
Audience reporting data is invaluable as it allows you to tailor future campaigns to your audiences based on how they interact with your content. This makes Google Analytics one of your greatest allies in building remarketing campaigns that can help push buyers that are on the fence to become paying customers.
With audience reporting, however, it's important to note that while this data is valuable, it is ultimately a general assumption. There is no definitive way for analytics tools to know exactly why a visitor came to your site. You will still need to utilize strategies such as A/B testing to explore new ways of engaging with your audience. However, these insights give you the target you need to aim for rather than aiming in the dark.
- Acquisition Reporting
Acquisition reporting within Google Analytics allows you to take a deep dive into exactly how your website acquires visitors. You can access a snapshot of your traffic through the Overview subsection found underneath Acquisition.
This will show you the top channels used to access your domain whether it be through organic keyword searches, social media, or direct navigation. You can also easily view statistics such as bounce rate, average session length, or conversions for your various custom goals, which we will cover later in this article.
Your Acquisition Reporting is further segmented into closer looks at the following:
- Channels (The method used to access your site)
- All Traffic (The top traffic sources from all channels)
- All Referrals (Websites and social media links to your site)
- Campaigns (Visitors from ad campaigns using UTM parameters)
- Keywords (An analysis of keywords used for organic and paid search)
- Cost Analysis (The costs per session)
- Social (Activity from social media including referrals and conversions)
- SEO (Impressions, Clicks, Ranking, Clickthrough Rate, etc.)
The Acquisition reporting tab provides you with comprehensive data that can positively impact every aspect of your digital marketing. From optimizing on-page content to improving site health to improving your overall search rankings, Acquisition reporting through Google Analytics will allow you to operate your website like a professional.
While all of Google Analytics' tools will improve your game, spend time getting familiar with each column and metric available in this section of the platform. These insights will allow you to create highly personalized campaigns and advertisements that push for better conversion rates than your initial discovery efforts.
- Behavior Reporting
The Behavior Reporting section is invaluable for learning exactly how your visitors spend time on your website. This will not only cover the basics such as time spent but will demonstrate the behavior flow of your visitors.
Behavior flow is a term used to describe how a visitor moves from one page to the next on a website. An example of a behavior flow would be as follows:
Home Page > Services Page (2nd Interaction) > Service A Page (3rd Interaction) > Contact Page (4th) Interaction
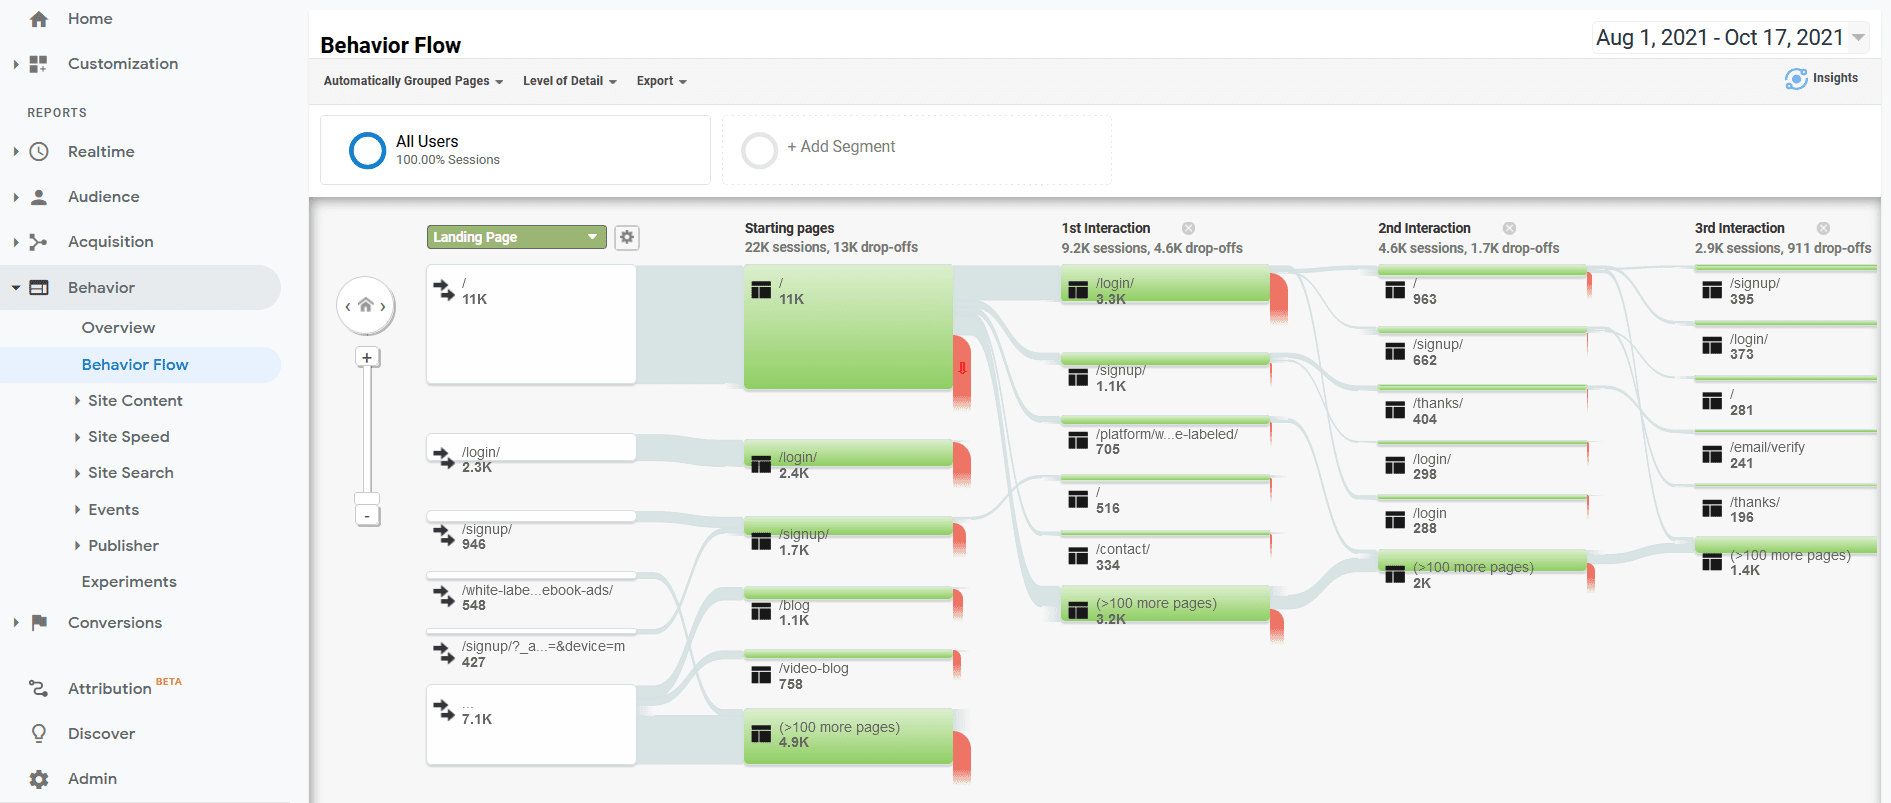
If significant portions of our audience follow this behavior flow, we can deduce that something about our content is driving visitors to learn more about a specific service before inquiring how to contact the business. We could then look into link clicks or form submissions within our events to determine if any further action was taken beyond this page navigation.
Gaining a visualization of your audience's behavior flow can give you a greater understanding of how your content impacts the user's choices. This is tremendously advantageous when you are attempting to funnel users to specific sections or your site to trigger specific events or goals.
Behavior reporting will also give insights such as time spent or bounce rate for every page. If users are spending more time on a page, it's a great sign that our content is effective and keeping audiences engaged. To contrast this, a high bounce rate on a page means that we need to improve the content on a page to avoid losing visitors at that point in the sales process.
Finally, Google Analytics also features an Event Flow visualization that can help you track a visitor's journey when engaging with a flow of events as opposed to pages. This is a highly important tool if you happen to be running a campaign on your site that requires users to participate in events within a sequence. A multi-page form would be an example of this as it includes engaging with form fields, following links, and submitting the data upon completion.
When you gain a mastery level of knowledge over your audience, you can cater your website and campaigns to suit their needs while still reaching your goals.
- Conversions Reporting
The point of Conversions Reporting is to help you determine if and how your website is helping you to drive conversions. A conversion can simply be a sale (the end goal) or any other custom, predefined goal you set for your website.
Not unlike the behavior and event flows, Conversions features reports that can help you visualize your goal path and the actions users take on their journey to fulfilling that goal.
The most common strategy for tracking goals is to push users to a confirmation page any time they complete a goal (making a purchase, completing a form, etc.). In your Conversions reporting, that page will display a high goal success rate. However, Google Analytics allows you to create as many steps in that goal as you would like so that you can track performance at each step and learn when users abandon the conversion. An example of a multi-step conversion might look like this:
Add to Cart (Step 1) > Enter Shipping Information (Step 2) > Enter Payment & Billing Details (Step 3) > Review Your Checkout Info (Step 4) > Complete Purchase (Goal)
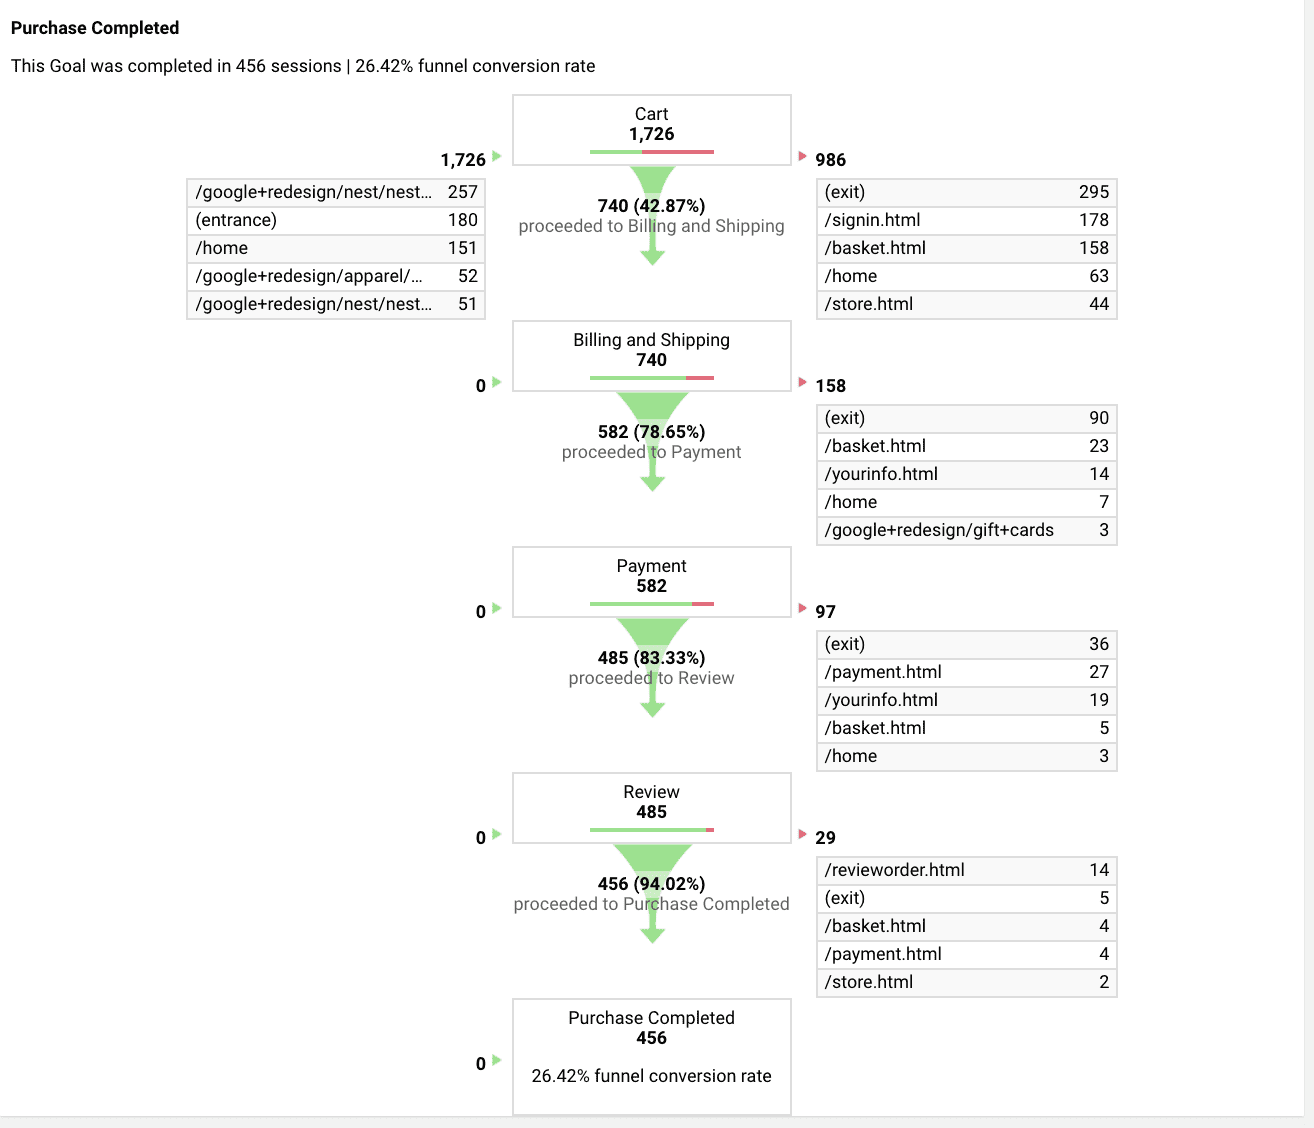
As a general rule, it's easier to drive conversions with as few steps as possible. However, this is not always possible. With Conversions reporting, you not only track when users reach the finish line but can count your wins at each step. If large numbers of users are abandoning the process as step 3, for example, there may be ways we need to improve that part of the process.
Familiarize yourself with Conversion reports to help guide you in achieving your various business goals. In this way, Google Analytics can become your greatest ally when it comes to increasing your sales.
5. Set Up Your Custom Goals in Google Analytics
Now that you've gained familiarity with the wealth of reporting options available, it's time to set up your own custom goals in Google Analytics. This elevates your data from simply being informative and helps you to visualize how your business goals and needs match up with how visitors engage with your brand.
As we briefly described above, a goal can be an act of any kind that you wish for a user to perform when visiting your website. You can begin the process of creating custom goals by navigating to Admin > All Website Data > Goals.
Google Analytics features an intuitive setup process that walks you through the goal creation process step-by-step. It even features pre-built templates for common goals that other Google Analytics users frequently employ. These templated goals include actions like payments, account creation, contact inquiries, or media plays. If one of these suits your needs, you can start there. Otherwise, go to the bottom and click Custom.
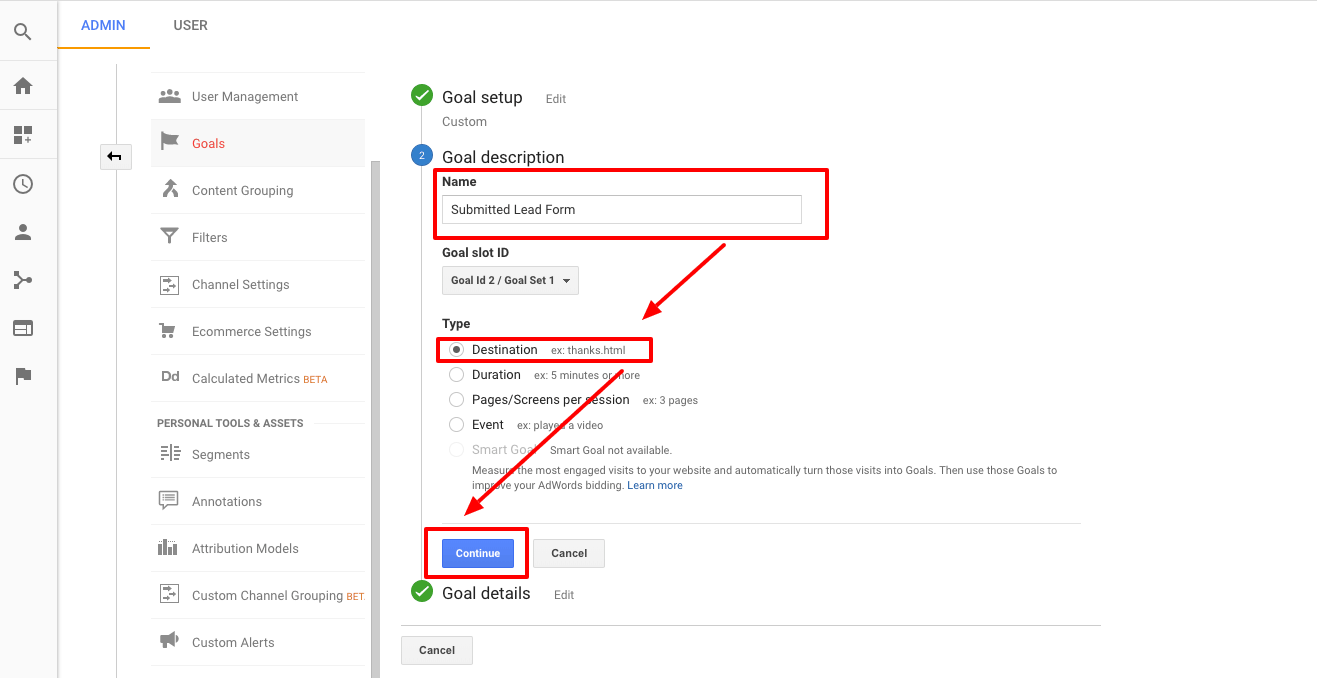
Next, you’ll need to select the type of goal you want to set up within your Google Analytics account. Your goal will fall under one of four umbrella categories including:
- Destination (Track when a user arrives at a designated place on your site)
- Visit Duration (Set a goal for how long you wish for a user session to be)
- Pages Visited Per Session (Set a goal for how many pages you want a user to interact with)
- Events (Assign a specific action as an event and track every time a user performs it)
It may take testing for you to create custom goals that accurately define what you need for a user to accomplish. With the help of all of the reporting options available, your initial goals may provide insight into what you need to do when creating new goals, so that you can further optimize website performance.
Remember from above that you can track all of this data in real-time, make corrections on the fly, and gain a horde of in-depth data that can help to push conversions further. When using Google Analytics, you set your goals, watch how the data lines up with your goals, and continuously optimize aspects of your website and campaigns to keep pushing the numbers in your favor.
6. Don't Forget About the Demographics and Interest Reports
Finally, you should know that Google Analytics offers Demographics and Interests Reports that can further improve your insights about your visitors. However, this feature must be manually enabled to take effect. To do this, find the Audience while selecting your domain. Then click on Demographics > Overview. You can then find a blue button that to click that says Enable.
After this, you're all set. This process is not instantaneous, and it may take several days for your new data to populate in the dashboard.
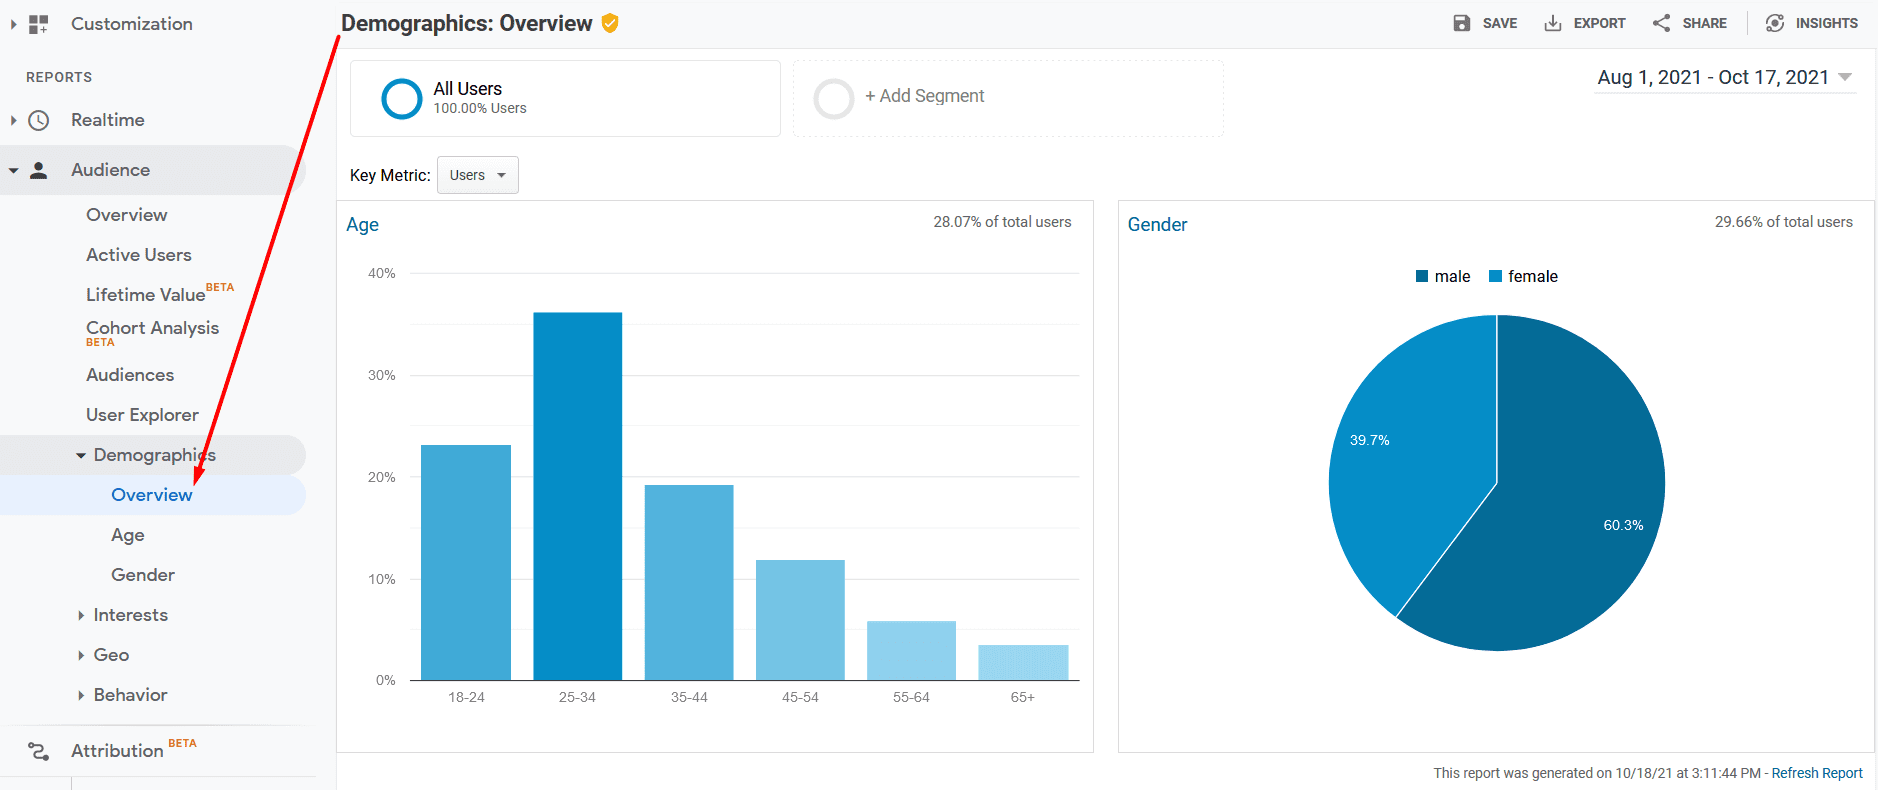
This reporting feature will show you valuable personal data regarding the audience that is visiting your website. However, a key feature is that it also shows the other interests that these users have that may or may not be related to your brand. The more well-rounded the visualization of your potential customers is, the better equipped you are to create campaigns tailored to their wants and needs.
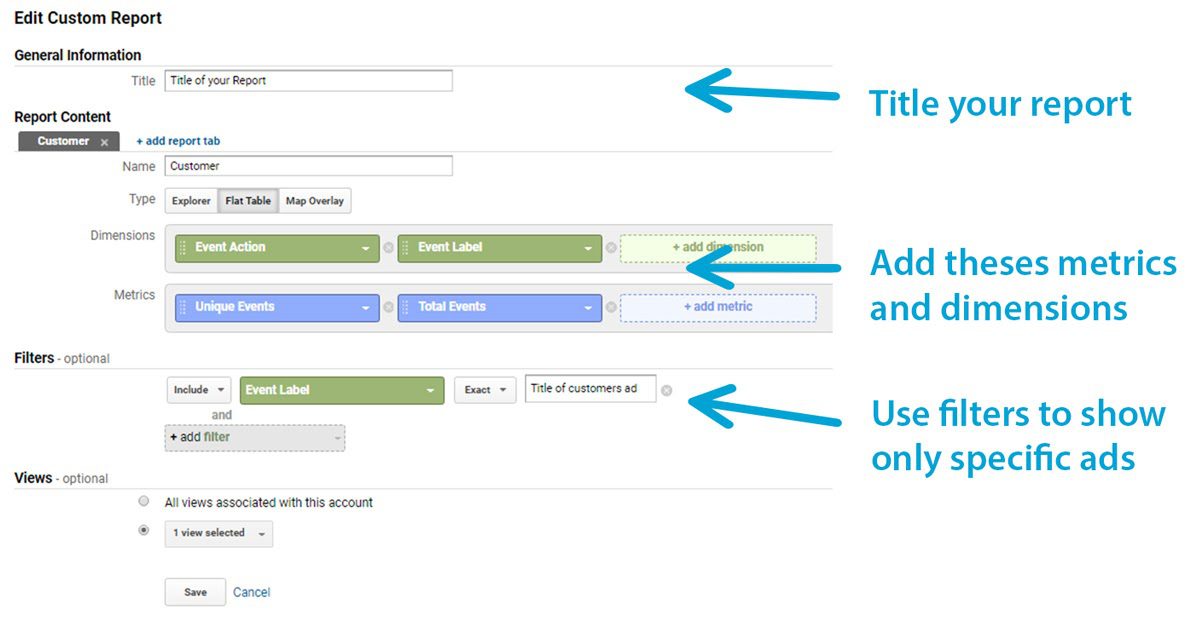
7. Finally, Track What You Want with Custom Reports
If there's anything left to learn from what Google Analytics has to offer, it's that there is no one-size-fits-all solution for every business. For this reason, Google Analytics also offers you the ability to create customized reports to track the metrics most critical to your unique goals and success.
To create a custom report within Google Analytics, find the Customization section within the left-hand column. Then, click on Custom Reports underneath it. You can create new reports by clicking on + New Custom Report and even categorize them by clicking + New Category. There are four major types of custom reports, including:
- Explorer (A line graph with a data table – the basic report you should be familiar with now)
- Flat Table (A general table that allows you to custom sort your columns and rows)
- Map Overlay (Contains a geographic map that’s color-coded to represent key metrics)
- Funnel (Generate a graph of your funnel steps and see which were completed by users and which were not)
You can also take advantage of the Google Solutions Gallery by clicking on Import from Gallery. This allows you to browse and select countless custom reports generated by other business owners and marketers like yourself. While these custom reports were made by the user for their needs, you may find other like-minded individuals who already created exactly what you need.
Custom reporting exists primarily due to the sheer amount of data available within Google Analytics. While all of it is extremely valuable, it only is so in the correct circumstances. By setting up a custom report that better aligns with your business goals, you can save countless hours by sorting out that data automatically and capturing exactly what you and your partners need to see. This allows you to examine the data with purpose, rather than manually clicking through the data each week or each month.
Navigate Google Analytics Like a Pro for Website and Marketing Success!
Google Analytics dominates the market for website analytics for great reason. For zero cost, you have access to countless intuitive tools and reporting features that can automatically track exactly what happens on your website, how your audience engages, and then use that data to improve in every area.
The moderate time investment of learning Google Analytics is worthwhile as it can single-handedly be the deciding factor in making better content for your website and improving steps on your website to achieve more conversions. You can also quickly sort that data by creating custom goals and custom reports so that you can capture and use that information with a purpose.
In addition to setting up your Google Analytics account, don't forget to crawl and index your website with Google Search Console to improve your site health. Failure to do so will completely undermine any marketing efforts taken with the help of this incredible tool. Also, be sure to set up your Google Tag Manager on any site where marketing actions are taken so that you can more easily track your events and conversions.
Now that you're familiar with everything that Google Analytics has to offer, the only thing left is to analyze your domain and start testing these features for yourself. With time and application, Google Analytics will become a critical ally for your business success just as it has been for countless others to date.


.svg)


.svg)
.svg)
.svg)
.svg)
.svg)