

.svg)

.svg)
.svg)
.svg)
.svg)
.svg)
Every successful marketing campaign is driven by real-time data and analysis. However, it quickly can become a nightmare to track your data across a variety of accounts, platforms, and tools employed by your business or marketing agency.
Microsoft's Power BI application promises to alleviate this exact issue and simplify the process of marketing data collection and reporting. By downloading their free application, you can start integrating all of your information sources in one place for either you, a small team, or your entire organization.
What is Power BI?
Power BI is a collection and visualization software that allows you to integrate and gather data from a variety of local and online sources to create robust and dynamic reports. The software provides users with the ability to import analytics from roughly 150 unique data sources to create clear visualizations and powerful insights to guide your business activity.
While many of these sources are integral to a successful marketing campaign, it can be difficult for the untrained individual to necessarily make sense of the figures available. When you use Power BI, you can create a central goal for your report, draw in data from the relevant sources, and outline them in a way that allows for a clear understanding for both your team and your clients.
Power BI exists across three different services including the desktop application (free for all Windows users), the cloud service (for paid members only), and the mobile application for reviewing reports on the go. The desktop application is all you truly need for creating new reports, but the cloud service allows you to quickly share your projects with everyone else in your network.

For paid plans, the cloud service will run you $9.99/month and grant you 10GB of storage and up to eight data source refreshes per day. Their Premium plan costs $20.00/month per user, grants 100TB of shared storage, 48 refreshes per day, and offers additional modeling and visualization tools including advanced AI and dataflows. Finally, Microsoft offers an enterprise-level plan at $4,995/month for the entire organization. You get access tool on the platform, maximum benefits, and the ability to share seamlessly across your entire team. You can learn more about pricing and benefits here.
Finally, as an enterprise Power BI consulting company, Power BI can draw in data for your reports from a variety of sources including:
- Microsoft Excel
- PDF, CSV, Text
- IBM Product Suite
- Azure
- Amazon Redshift
- Salesforce Products
- Google Analytics
- Adobe Analytics
- Twilio
- Quickbooks
- Zendesk
- Zoho
- And much more (nearly 150 sources in total)
How Can I Use Power BI?
Getting started with Power BI is effortless. Simply head over to this link and click the “Download Free” button. On newer Windows machines, this will provide a notice asking you if you would like to open the Microsoft Store on your desktop. Do so, then click to download the application.
If you wish to start out with a paid membership or upgrade your existing plan, you’ll need to navigate to the pricing link given above in the previous section. Click “Buy Now” and follow the steps on the screen to purchase your monthly subscription. You will require a Power BI account, which can quickly be created so long as you have an existing email associated with a Microsoft account. A Microsoft account is free and can be used to log in to a variety of applications and services both locally and online.
After you download the desktop application, you’re ready to get moving. Additional features may or may not be available depending upon your active monthly plan. There is currently no free trial available to test out the additional features only offered with paid subscriptions.
How to Create Marketing Reports with Power BI?
Microsoft's Power BI is relatively straightforward, so let's dive in and know the critical steps to creating marketing reports using Power BI.
Let's begin with how to import data in Power BI:
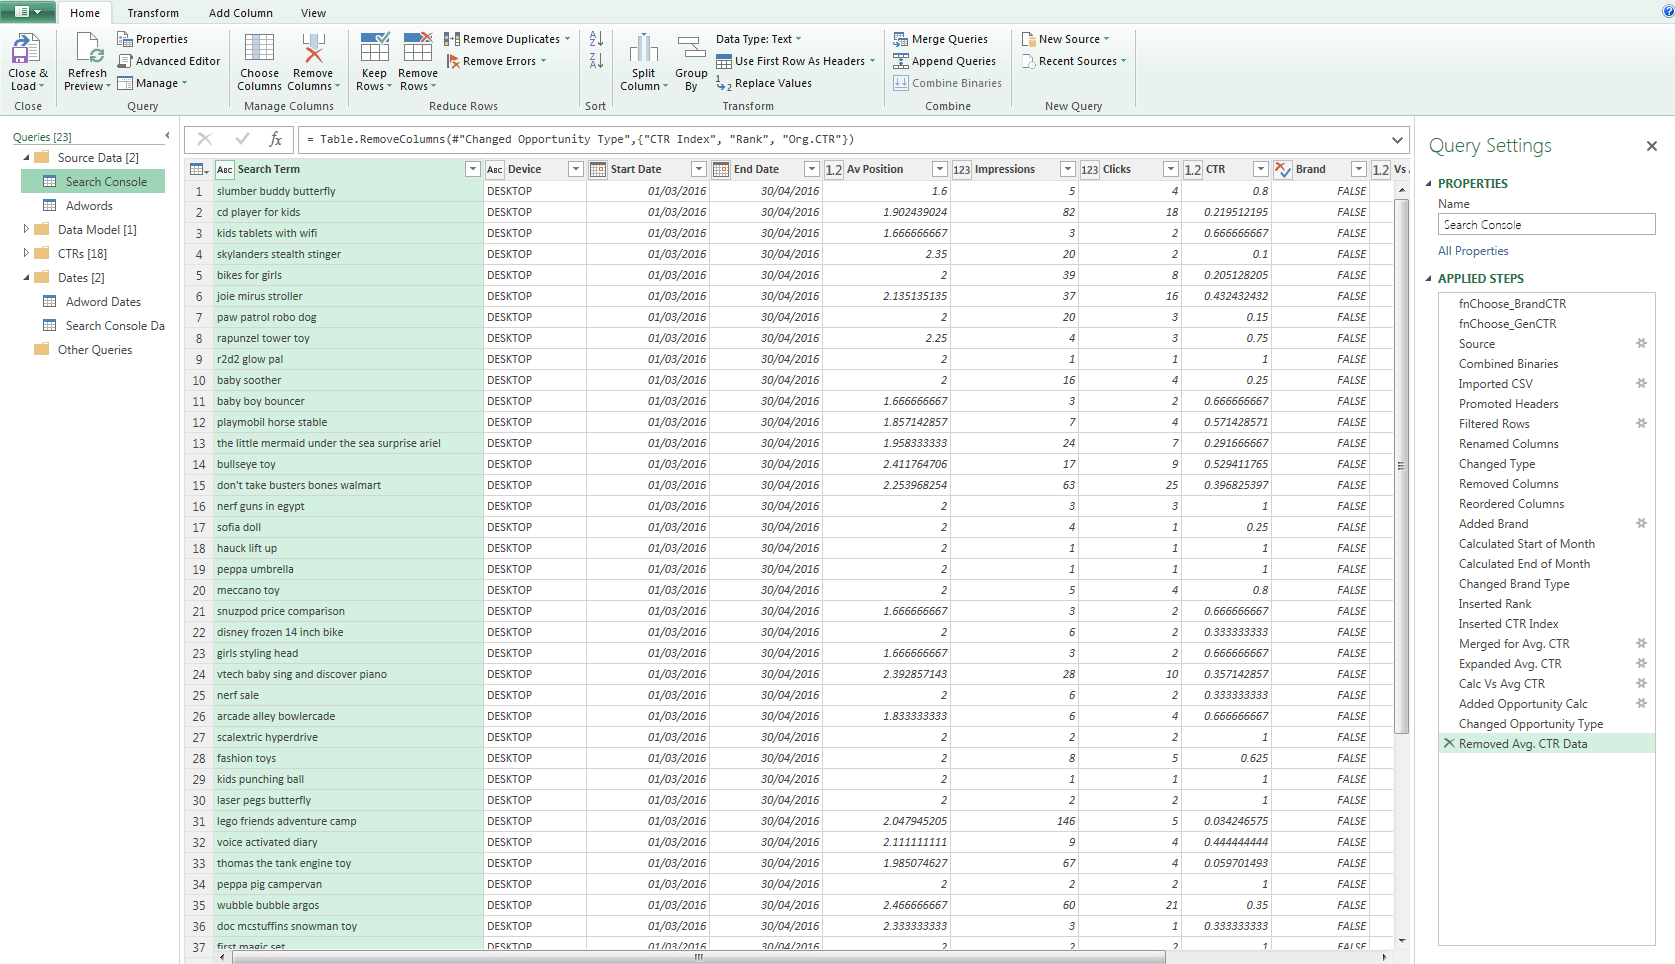
1. How to Import Data in Power BI
With Power BI installed and open on your computer, you should have your first untitled blank report open by default. The screen should appear something like this:
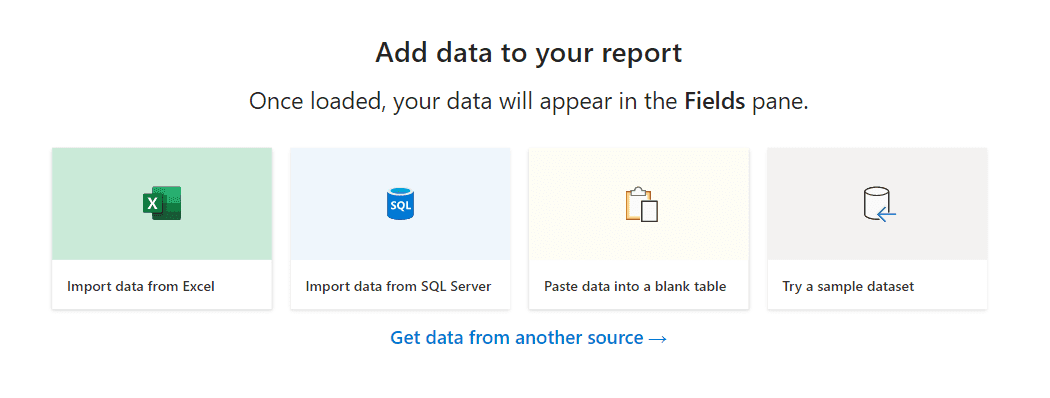
To get started, you will need to import data from at least one source. You can select from one of the pictured sources or click on “Get data from another source.” For future reference, you can also import additional data by clicking on “Get data” in the top menu pictured below:
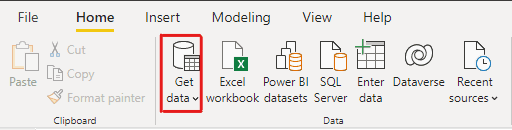
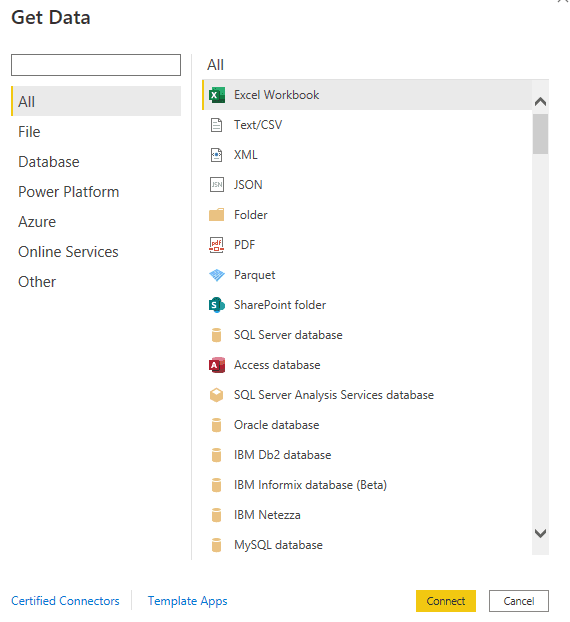
After clicking this button, you’ll receive a list of common data sources, but can access more by clicking “more.” This will provide you with the full list of possible services you can connect with Power BI for your reports. You only need to connect one source but have the ability to connect as many as you would like.
2. Create and Manage Relationships Between Data
After you integrate the data for your report into Power BI, you need to establish relationships between data points. These relationships form the basis of how you want to model your data for presentation. You can do this in one of two ways. The first is to select the “Modeling” tab from the top menu. From there, you can select “Manage Relationships” to start pairing related metrics. You can also quickly create new columns and tables to perform automated calculations based on the data you select.
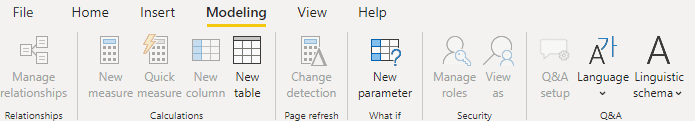
The second is to select the Model button from the left-side menu. This looks like three modules with lines running through to indicate their connection.
In this menu, you can verify that the characteristic attributed to the metric is correct and easily connect or disconnect two or more properties. To create a relationship, drag and any fields you want to connect between two adjacent tables. To delete relationships, right-click and select “Delete.”
Power BI offers many tools and options for modeling your data, which you can learn more about by taking Microsoft's free, quick training course here. The entire module takes roughly an hour and provides examples and practice problems to verify your knowledge of the platform. Ensuring that you understand how to model your data appropriately is the foundation for creating dynamic and impressive reports for your team and clients. There are few more Power BI courses available online to exile your career in Power BI as a marketer.
3. Choose a Visualization for Your Data
A visualization option is an image or graph that takes your data, the relationships, and presents it in an easily digestible manner for your audience. Examples of visualization options include tables, pie charts, bar graphs, line charts, or waterfall charts. You can find the list of visualizations within one of the collapsible menus on the right side of the screen.

You can get access to additional visualizations with paid plans. Users can also import custom visualization files from trusted developers. If you want to learn more about how you can start creating your own visuals for Power BI, check out this tutorial from Microsoft here.
4. Further Testing and Customization
After importing your data, establishing relationships, implementing visualizations, and adding notes, you can make additional customizations to finalize your report. Head over to the “View” tab to select from a variety of colorful themes that can enhance and personalize your presentation. You can even test how your reports view on mobile devices to ensure that your team or clients receive the best experience no matter where they interact with your report.
This menu also allows you to create custom filters and bookmarks that users can interact with as they move through your report. This can highly key data points that you want to stand out and help users more readily find the metrics that are most pertinent to their needs.
The “Insert” tab also features customization options that may prove useful in certain scenarios. From here, you can add text boxes, create custom buttons to trigger events or change pages, or add images to augment your visualizations. There is also a “Smart Narrative” option that utilizes AI technology to automatically write summaries for you based on the data in a selected visual.
5. Exporting Your Data
When your report is ready to share, you can just as easily export your data as you imported it. Simply move over to “File” and select “Export” from the list of options. You can save your custom report as either a Power BI file to be used exclusively in this application or as a general PDF that can be viewed with a variety of software.
If you’re on a cloud-based plan and wish to share your work with your team, you can select “Publish” to push your report to Power BI services. Any users that operate in the same workspace will be able to discover and view any new reports that come from your desktop.
Use Cases for Power BI in Marketing
Now that we've covered the basics of how to create a customized report in Power BI, let's consider how this tool can augment and improve our marketing services.
As we know, the work of a marketer in 2021 is powered by and driven by automation and analytics. If you research any guides or tutorials on how to improve your SEO, PPC campaigns, enhance your website, and so on, you'll be pointed to a wide variety of analytics tools and software that automatically track user activity and gather data in real-time. As you may have noticed, nearly all of these resources are featured as possible connectors within Power BI. As a result, you'll have an easy time creating reports for the following:
Track Your ROI for Keywords and Organic Search
Google Analytics houses much of the data that is relevant to your SEO and organic search campaigns. You can track important data such as your ranked keywords, daily web traffic, search volume, page clicks, and much more. By integrating your Google Analytics data into Power BI, you can quickly compile select data points into tables and graphs to create beautiful, dynamic reports.
Not only will this simplify the process of choosing which data to analyze for your team, but your personalized reports will make your agency look like you're on top of the game when presenting to your clients. You no longer need to worry about scrambling to gather or access the relevant data, as you can save models as Power BI report templates and reuse them for monthly reporting.
Compare Results for Paid Advertising Campaigns
Likewise, you can integrate a variety of online services into Power BI that you may be using to create PPC campaigns and launch new landing pages. Your Power BI reports can focus on a variety of focal points. This could include the numbers behind your A/B testing to help you push for a specific creative or page variation or your average ROI between an existing campaign and past campaigns.
Because there is no limit to the number of connectors you can have in place for a given report, you could even create a report that compares the ROI for organic marketing efforts versus paid ones. These types of reports can provide valuable insights such as which strategies deserve more focus and get results. However, it can also highlight problem areas that require more attention. Without the ability to gather these metrics in one easy-to-read visualization, even the best marketing team can fall guilty of letting these issues spiral before they become unmanageable.
Be Better Prepared for Client Presentations
No matter how well your team prepares for a weekly or monthly presentation with your clients, their minds inevitably operate on a different wavelength than your team. As a result, you find yourself dealing with awkward moments when a question arises that you don't have the answer to. You know you have the analytics available, but it takes time to sort and process the data to come up with an expert response.
By integrating all of your data into Power BI and modeling the relationships upfront, you can more readily sort through your client's analytics in a dynamic manner. You won't need to have your team dedicate as much time understanding the data as your new reporting software has already completed that work for you. As a result, you can provide more valuable insights than normal in real-time. This helps your team appear one step ahead and allows you to tackle problems with your clients in real-time and formulate a game plan for the days and weeks ahead.
Sell Clients on Additional Services
Marketing analytics does not only benefit active services but can be used as case studies to reinforce your sales efforts. When you're able to connect analytics regarding a client's organic or paid marketing efforts, you can compare it to other reports you have for clients that are receiving improved results with the additional services you're attempting to sell.
Power BI makes it easy for you to delete relationships and remove metrics that might reveal private or sensitive data that would harm the privacy of your customers. Utilize the tools available to compare the relevant metrics, and allow the numbers to make the argument of how certain tools, strategies, or services might get the desired results at an additional expense. This is a powerful way of converting both existing customers and prospective clients.
Power BI for Marketers - Improve Your Reporting Efforts!
All of your agency's marketing efforts are driven by analytics and reporting tools. It's not enough to simply gather a list of figures, but you need to ensure that your reports outline the data in a manner that guides your team's strategy. Power BI offers a complete package solution by allowing you to integrate nearly 150 unique data sources that your marketing team is already using to get the job done.
Even with the free plan, your connected data sources will refresh up to a minimum of eight times per day, granting you more than enough leeway to ensure that your reporting is always correct and up-to-date. If you're a much larger business that demands even more data and reporting options for a wide array of clients, you can share Power BI between several users on your team for a slightly upgraded fee per person.
With zero cost to entry and how simple it is to connect your data, there's no reason not to experiment with Power BI and determine if it's a good fit. However, because this is a Microsoft product, it will only really be of benefit to teams using PCs. Don't worry if you're a Mac family, as there are a variety of alternatives available online if Power BI doesn't suit all of your marketing needs.

.svg)


.svg)
.svg)
.svg)
.svg)
.svg)